Why You Should Like Binjiang Services Group Co. Ltd.’s (HKG:3316) ROCE

Today we are going to look at Binjiang Services Group Co. Ltd. (HKG:3316) to see whether it might be an attractive investment prospect. Specifically, we'll consider its Return On Capital Employed (ROCE), since that will give us an insight into how efficiently the business can generate profits from the capital it requires.
Firstly, we'll go over how we calculate ROCE. Then we'll compare its ROCE to similar companies. Then we'll determine how its current liabilities are affecting its ROCE.
Return On Capital Employed (ROCE): What is it?
ROCE is a measure of a company's yearly pre-tax profit (its return), relative to the capital employed in the business. All else being equal, a better business will have a higher ROCE. Ultimately, it is a useful but imperfect metric. Author Edwin Whiting says to be careful when comparing the ROCE of different businesses, since 'No two businesses are exactly alike.
So, How Do We Calculate ROCE?
The formula for calculating the return on capital employed is:
Return on Capital Employed = Earnings Before Interest and Tax (EBIT) ÷ (Total Assets - Current Liabilities)
Or for Binjiang Services Group:
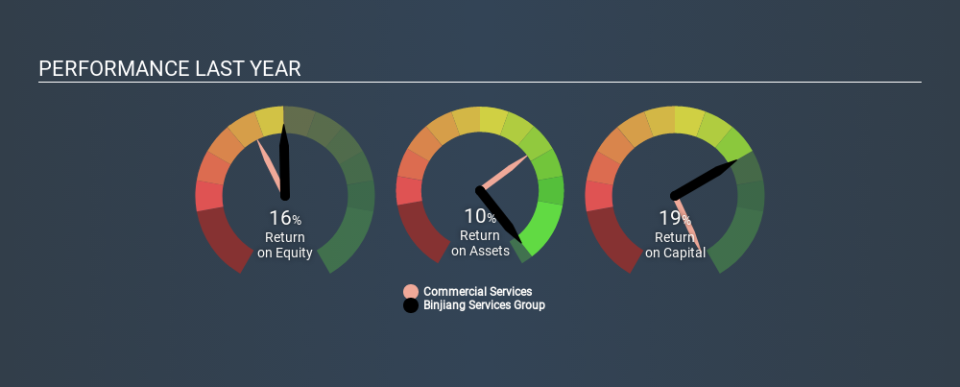
0.19 = CN¥140m ÷ (CN¥1.2b - CN¥476m) (Based on the trailing twelve months to December 2019.)
Therefore, Binjiang Services Group has an ROCE of 19%.
See our latest analysis for Binjiang Services Group
Is Binjiang Services Group's ROCE Good?
When making comparisons between similar businesses, investors may find ROCE useful. Using our data, we find that Binjiang Services Group's ROCE is meaningfully better than the 12% average in the Commercial Services industry. We would consider this a positive, as it suggests it is using capital more effectively than other similar companies. Regardless of where Binjiang Services Group sits next to its industry, its ROCE in absolute terms appears satisfactory, and this company could be worth a closer look.
Binjiang Services Group's current ROCE of 19% is lower than 3 years ago, when the company reported a 52% ROCE. This makes us wonder if the business is facing new challenges. You can click on the image below to see (in greater detail) how Binjiang Services Group's past growth compares to other companies.
It is important to remember that ROCE shows past performance, and is not necessarily predictive. ROCE can be misleading for companies in cyclical industries, with returns looking impressive during the boom times, but very weak during the busts. ROCE is only a point-in-time measure. You can check if Binjiang Services Group has cyclical profits by looking at this free graph of past earnings, revenue and cash flow.
Do Binjiang Services Group's Current Liabilities Skew Its ROCE?
Current liabilities include invoices, such as supplier payments, short-term debt, or a tax bill, that need to be paid within 12 months. Due to the way the ROCE equation works, having large bills due in the near term can make it look as though a company has less capital employed, and thus a higher ROCE than usual. To counteract this, we check if a company has high current liabilities, relative to its total assets.
Binjiang Services Group has total assets of CN¥1.2b and current liabilities of CN¥476m. As a result, its current liabilities are equal to approximately 40% of its total assets. Binjiang Services Group has a middling amount of current liabilities, increasing its ROCE somewhat.
What We Can Learn From Binjiang Services Group's ROCE
With a decent ROCE, the company could be interesting, but remember that the level of current liabilities make the ROCE look better. Binjiang Services Group shapes up well under this analysis, but it is far from the only business delivering excellent numbers . You might also want to check this free collection of companies delivering excellent earnings growth.
I will like Binjiang Services Group better if I see some big insider buys. While we wait, check out this free list of growing companies with considerable, recent, insider buying.
If you spot an error that warrants correction, please contact the editor at editorial-team@simplywallst.com. This article by Simply Wall St is general in nature. It does not constitute a recommendation to buy or sell any stock, and does not take account of your objectives, or your financial situation. Simply Wall St has no position in the stocks mentioned.
We aim to bring you long-term focused research analysis driven by fundamental data. Note that our analysis may not factor in the latest price-sensitive company announcements or qualitative material. Thank you for reading.

