Why Bisichi Mining Plc’s (LON:BISI) Return On Capital Employed Is Impressive

Today we'll look at Bisichi Mining Plc (LON:BISI) and reflect on its potential as an investment. Specifically, we're going to calculate its Return On Capital Employed (ROCE), in the hopes of getting some insight into the business.
Firstly, we'll go over how we calculate ROCE. Second, we'll look at its ROCE compared to similar companies. Last but not least, we'll look at what impact its current liabilities have on its ROCE.
Understanding Return On Capital Employed (ROCE)
ROCE is a metric for evaluating how much pre-tax income (in percentage terms) a company earns on the capital invested in its business. In general, businesses with a higher ROCE are usually better quality. Ultimately, it is a useful but imperfect metric. Renowned investment researcher Michael Mauboussin has suggested that a high ROCE can indicate that 'one dollar invested in the company generates value of more than one dollar'.
So, How Do We Calculate ROCE?
Analysts use this formula to calculate return on capital employed:
Return on Capital Employed = Earnings Before Interest and Tax (EBIT) ÷ (Total Assets - Current Liabilities)
Or for Bisichi Mining:
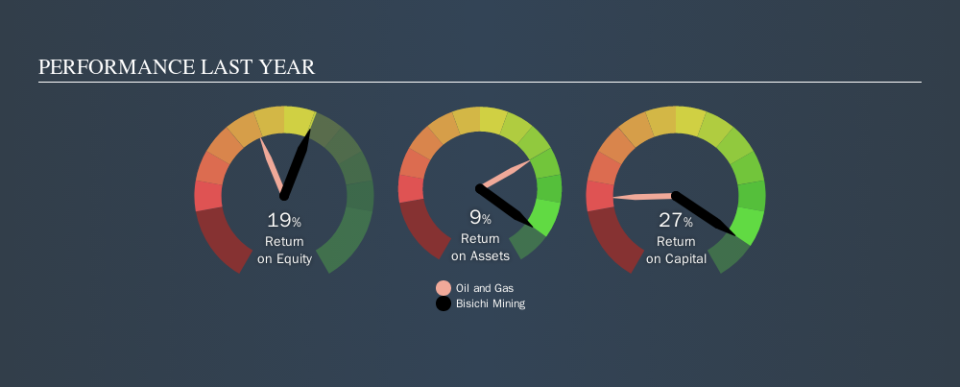
0.27 = UK£7.3m ÷ (UK£46m - UK£19m) (Based on the trailing twelve months to June 2019.)
So, Bisichi Mining has an ROCE of 27%.
View our latest analysis for Bisichi Mining
Does Bisichi Mining Have A Good ROCE?
ROCE can be useful when making comparisons, such as between similar companies. In our analysis, Bisichi Mining's ROCE is meaningfully higher than the 8.7% average in the Oil and Gas industry. We would consider this a positive, as it suggests it is using capital more effectively than other similar companies. Setting aside the comparison to its industry for a moment, Bisichi Mining's ROCE in absolute terms currently looks quite high.
In our analysis, Bisichi Mining's ROCE appears to be 27%, compared to 3 years ago, when its ROCE was 1.0%. This makes us wonder if the company is improving. You can click on the image below to see (in greater detail) how Bisichi Mining's past growth compares to other companies.
Remember that this metric is backwards looking - it shows what has happened in the past, and does not accurately predict the future. Companies in cyclical industries can be difficult to understand using ROCE, as returns typically look high during boom times, and low during busts. This is because ROCE only looks at one year, instead of considering returns across a whole cycle. Remember that most companies like Bisichi Mining are cyclical businesses. You can check if Bisichi Mining has cyclical profits by looking at this free graph of past earnings, revenue and cash flow.
Bisichi Mining's Current Liabilities And Their Impact On Its ROCE
Liabilities, such as supplier bills and bank overdrafts, are referred to as current liabilities if they need to be paid within 12 months. Due to the way ROCE is calculated, a high level of current liabilities makes a company look as though it has less capital employed, and thus can (sometimes unfairly) boost the ROCE. To counter this, investors can check if a company has high current liabilities relative to total assets.
Bisichi Mining has total assets of UK£46m and current liabilities of UK£19m. Therefore its current liabilities are equivalent to approximately 41% of its total assets. Bisichi Mining's ROCE is boosted somewhat by its middling amount of current liabilities.
What We Can Learn From Bisichi Mining's ROCE
Despite this, it reports a high ROCE, and may be worth investigating further. Bisichi Mining shapes up well under this analysis, but it is far from the only business delivering excellent numbers . You might also want to check this free collection of companies delivering excellent earnings growth.
If you are like me, then you will not want to miss this free list of growing companies that insiders are buying.
We aim to bring you long-term focused research analysis driven by fundamental data. Note that our analysis may not factor in the latest price-sensitive company announcements or qualitative material.
If you spot an error that warrants correction, please contact the editor at editorial-team@simplywallst.com. This article by Simply Wall St is general in nature. It does not constitute a recommendation to buy or sell any stock, and does not take account of your objectives, or your financial situation. Simply Wall St has no position in the stocks mentioned. Thank you for reading.

