Why Blue Financial Communication S.p.A.’s (BIT:BLUE) Use Of Investor Capital Doesn’t Look Great

Today we'll look at Blue Financial Communication S.p.A. (BIT:BLUE) and reflect on its potential as an investment. In particular, we'll consider its Return On Capital Employed (ROCE), as that can give us insight into how profitably the company is able to employ capital in its business.
Firstly, we'll go over how we calculate ROCE. Then we'll compare its ROCE to similar companies. Last but not least, we'll look at what impact its current liabilities have on its ROCE.
Return On Capital Employed (ROCE): What is it?
ROCE is a measure of a company's yearly pre-tax profit (its return), relative to the capital employed in the business. Generally speaking a higher ROCE is better. Ultimately, it is a useful but imperfect metric. Renowned investment researcher Michael Mauboussin has suggested that a high ROCE can indicate that 'one dollar invested in the company generates value of more than one dollar'.
So, How Do We Calculate ROCE?
Analysts use this formula to calculate return on capital employed:
Return on Capital Employed = Earnings Before Interest and Tax (EBIT) ÷ (Total Assets - Current Liabilities)
Or for Blue Financial Communication:
0.037 = €103k ÷ (€4.1m - €1.3m) (Based on the trailing twelve months to December 2018.)
Therefore, Blue Financial Communication has an ROCE of 3.7%.
Check out our latest analysis for Blue Financial Communication
Does Blue Financial Communication Have A Good ROCE?
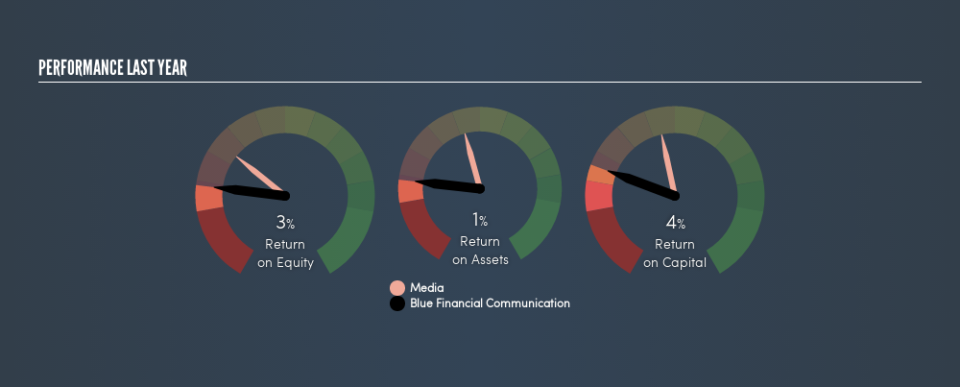
ROCE is commonly used for comparing the performance of similar businesses. Using our data, Blue Financial Communication's ROCE appears to be significantly below the 8.7% average in the Media industry. This could be seen as a negative, as it suggests some competitors may be employing their capital more efficiently. Regardless of how Blue Financial Communication stacks up against its industry, its ROCE in absolute terms is quite low (especially compared to a bank account). It is likely that there are more attractive prospects out there.
We can see that , Blue Financial Communication currently has an ROCE of 3.7%, less than the 11% it reported 3 years ago. Therefore we wonder if the company is facing new headwinds. You can click on the image below to see (in greater detail) how Blue Financial Communication's past growth compares to other companies.
Remember that this metric is backwards looking - it shows what has happened in the past, and does not accurately predict the future. ROCE can be misleading for companies in cyclical industries, with returns looking impressive during the boom times, but very weak during the busts. ROCE is only a point-in-time measure. Since the future is so important for investors, you should check out our free report on analyst forecasts for Blue Financial Communication.
How Blue Financial Communication's Current Liabilities Impact Its ROCE
Short term (or current) liabilities, are things like supplier invoices, overdrafts, or tax bills that need to be paid within 12 months. Due to the way the ROCE equation works, having large bills due in the near term can make it look as though a company has less capital employed, and thus a higher ROCE than usual. To counter this, investors can check if a company has high current liabilities relative to total assets.
Blue Financial Communication has total assets of €4.1m and current liabilities of €1.3m. As a result, its current liabilities are equal to approximately 32% of its total assets. In light of sufficient current liabilities to noticeably boost the ROCE, Blue Financial Communication's ROCE is concerning.
What We Can Learn From Blue Financial Communication's ROCE
There are likely better investments out there. But note: make sure you look for a great company, not just the first idea you come across. So take a peek at this free list of interesting companies with strong recent earnings growth (and a P/E ratio below 20).
If you like to buy stocks alongside management, then you might just love this free list of companies. (Hint: insiders have been buying them).
We aim to bring you long-term focused research analysis driven by fundamental data. Note that our analysis may not factor in the latest price-sensitive company announcements or qualitative material.
If you spot an error that warrants correction, please contact the editor at editorial-team@simplywallst.com. This article by Simply Wall St is general in nature. It does not constitute a recommendation to buy or sell any stock, and does not take account of your objectives, or your financial situation. Simply Wall St has no position in the stocks mentioned. Thank you for reading.

