Why Boardroom Limited’s (SGX:B10) High P/E Ratio Isn’t Necessarily A Bad Thing

This article is for investors who would like to improve their understanding of price to earnings ratios (P/E ratios). We’ll look at Boardroom Limited’s (SGX:B10) P/E ratio and reflect on what it tells us about the company’s share price. Based on the last twelve months, Boardroom’s P/E ratio is 12.88. That means that at current prices, buyers pay SGD12.88 for every SGD1 in trailing yearly profits.
See our latest analysis for Boardroom
Want to help shape the future of investing tools and platforms? Take the survey and be part of one of the most advanced studies of stock market investors to date.
How Do You Calculate A P/E Ratio?
The formula for price to earnings is:
Price to Earnings Ratio = Price per Share ÷ Earnings per Share (EPS)
Or for Boardroom:
P/E of 12.88 = SGD0.73 ÷ SGD0.057 (Based on the year to September 2018.)
Is A High P/E Ratio Good?
A higher P/E ratio means that investors are paying a higher price for each SGD1 of company earnings. That is not a good or a bad thing per se, but a high P/E does imply buyers are optimistic about the future.
How Growth Rates Impact P/E Ratios
P/E ratios primarily reflect market expectations around earnings growth rates. Earnings growth means that in the future the ‘E’ will be higher. That means even if the current P/E is high, it will reduce over time if the share price stays flat. Then, a lower P/E should attract more buyers, pushing the share price up.
Boardroom increased earnings per share by an impressive 23% over the last twelve months. And its annual EPS growth rate over 5 years is 7.3%. So one might expect an above average P/E ratio.
How Does Boardroom’s P/E Ratio Compare To Its Peers?
We can get an indication of market expectations by looking at the P/E ratio. The image below shows that Boardroom has a P/E ratio that is roughly in line with the professional services industry average (12.7).
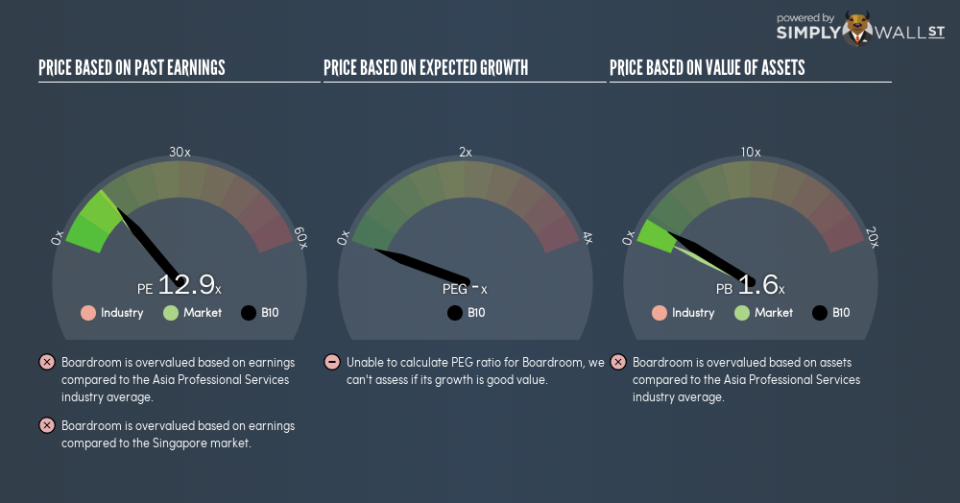
Boardroom’s P/E tells us that market participants think its prospects are roughly in line with its industry. So if Boardroom actually outperforms its peers going forward, that should be a positive for the share price. Further research into factors such asmanagement tenure, could help you form your own view on whether that is likely.
A Limitation: P/E Ratios Ignore Debt and Cash In The Bank
Don’t forget that the P/E ratio considers market capitalization. That means it doesn’t take debt or cash into account. In theory, a company can lower its future P/E ratio by using cash or debt to invest in growth.
Such expenditure might be good or bad, in the long term, but the point here is that the balance sheet is not reflected by this ratio.
Boardroom’s Balance Sheet
Boardroom has net debt worth 18% of its market capitalization. It would probably deserve a higher P/E ratio if it was net cash, since it would have more options for growth.
The Bottom Line On Boardroom’s P/E Ratio
Boardroom trades on a P/E ratio of 12.9, which is above the SG market average of 11.9. Its debt levels do not imperil its balance sheet and it has already proven it can grow. So it is not surprising the market is probably extrapolating recent growth well into the future, reflected in the relatively high P/E ratio.
When the market is wrong about a stock, it gives savvy investors an opportunity. If the reality for a company is better than it expects, you can make money by buying and holding for the long term. Although we don’t have analyst forecasts, shareholders might want to examine this detailed historical graph of earnings, revenue and cash flow.
Of course you might be able to find a better stock than Boardroom. So you may wish to see this free collection of other companies that have grown earnings strongly.
To help readers see past the short term volatility of the financial market, we aim to bring you a long-term focused research analysis purely driven by fundamental data. Note that our analysis does not factor in the latest price-sensitive company announcements.
The author is an independent contributor and at the time of publication had no position in the stocks mentioned. For errors that warrant correction please contact the editor at editorial-team@simplywallst.com.
