Why You Should Care About Eo2 Société Anonyme’s (EPA:ALEO2) Low Return On Capital

Today we'll evaluate Eo2 Société Anonyme (EPA:ALEO2) to determine whether it could have potential as an investment idea. Specifically, we'll consider its Return On Capital Employed (ROCE), since that will give us an insight into how efficiently the business can generate profits from the capital it requires.
Firstly, we'll go over how we calculate ROCE. Second, we'll look at its ROCE compared to similar companies. Last but not least, we'll look at what impact its current liabilities have on its ROCE.
What is Return On Capital Employed (ROCE)?
ROCE measures the 'return' (pre-tax profit) a company generates from capital employed in its business. In general, businesses with a higher ROCE are usually better quality. In brief, it is a useful tool, but it is not without drawbacks. Renowned investment researcher Michael Mauboussin has suggested that a high ROCE can indicate that 'one dollar invested in the company generates value of more than one dollar'.
So, How Do We Calculate ROCE?
Analysts use this formula to calculate return on capital employed:
Return on Capital Employed = Earnings Before Interest and Tax (EBIT) ÷ (Total Assets - Current Liabilities)
Or for Eo2 Société Anonyme:
0.031 = €751k ÷ (€30m - €5.7m) (Based on the trailing twelve months to February 2019.)
So, Eo2 Société Anonyme has an ROCE of 3.1%.
See our latest analysis for Eo2 Société Anonyme
Does Eo2 Société Anonyme Have A Good ROCE?
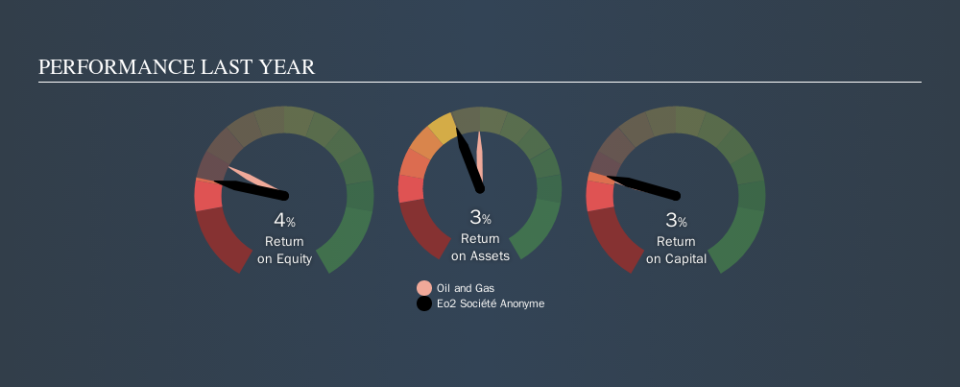
ROCE can be useful when making comparisons, such as between similar companies. We can see Eo2 Société Anonyme's ROCE is meaningfully below the Oil and Gas industry average of 4.9%. This performance could be negative if sustained, as it suggests the business may underperform its industry. Regardless of how Eo2 Société Anonyme stacks up against its industry, its ROCE in absolute terms is quite low (especially compared to a bank account). There are potentially more appealing investments elsewhere.
The image below shows how Eo2 Société Anonyme's ROCE compares to its industry, and you can click it to see more detail on its past growth.
When considering this metric, keep in mind that it is backwards looking, and not necessarily predictive. Companies in cyclical industries can be difficult to understand using ROCE, as returns typically look high during boom times, and low during busts. This is because ROCE only looks at one year, instead of considering returns across a whole cycle. Given the industry it operates in, Eo2 Société Anonyme could be considered cyclical. How cyclical is Eo2 Société Anonyme? You can see for yourself by looking at this free graph of past earnings, revenue and cash flow.
Eo2 Société Anonyme's Current Liabilities And Their Impact On Its ROCE
Liabilities, such as supplier bills and bank overdrafts, are referred to as current liabilities if they need to be paid within 12 months. Due to the way the ROCE equation works, having large bills due in the near term can make it look as though a company has less capital employed, and thus a higher ROCE than usual. To counteract this, we check if a company has high current liabilities, relative to its total assets.
Eo2 Société Anonyme has total liabilities of €5.7m and total assets of €30m. Therefore its current liabilities are equivalent to approximately 19% of its total assets. With a very reasonable level of current liabilities, so the impact on ROCE is fairly minimal.
Our Take On Eo2 Société Anonyme's ROCE
While that is good to see, Eo2 Société Anonyme has a low ROCE and does not look attractive in this analysis. Of course, you might also be able to find a better stock than Eo2 Société Anonyme. So you may wish to see this free collection of other companies that have grown earnings strongly.
If you like to buy stocks alongside management, then you might just love this free list of companies. (Hint: insiders have been buying them).
We aim to bring you long-term focused research analysis driven by fundamental data. Note that our analysis may not factor in the latest price-sensitive company announcements or qualitative material.
If you spot an error that warrants correction, please contact the editor at editorial-team@simplywallst.com. This article by Simply Wall St is general in nature. It does not constitute a recommendation to buy or sell any stock, and does not take account of your objectives, or your financial situation. Simply Wall St has no position in the stocks mentioned. Thank you for reading.
