Why You Should Care About Hotel Royal Limited’s (SGX:H12) Low Return On Capital

Today we are going to look at Hotel Royal Limited (SGX:H12) to see whether it might be an attractive investment prospect. To be precise, we'll consider its Return On Capital Employed (ROCE), as that will inform our view of the quality of the business.
First, we'll go over how we calculate ROCE. Then we'll compare its ROCE to similar companies. Finally, we'll look at how its current liabilities affect its ROCE.
What is Return On Capital Employed (ROCE)?
ROCE is a metric for evaluating how much pre-tax income (in percentage terms) a company earns on the capital invested in its business. All else being equal, a better business will have a higher ROCE. In brief, it is a useful tool, but it is not without drawbacks. Renowned investment researcher Michael Mauboussin has suggested that a high ROCE can indicate that 'one dollar invested in the company generates value of more than one dollar'.
How Do You Calculate Return On Capital Employed?
The formula for calculating the return on capital employed is:
Return on Capital Employed = Earnings Before Interest and Tax (EBIT) ÷ (Total Assets - Current Liabilities)
Or for Hotel Royal:
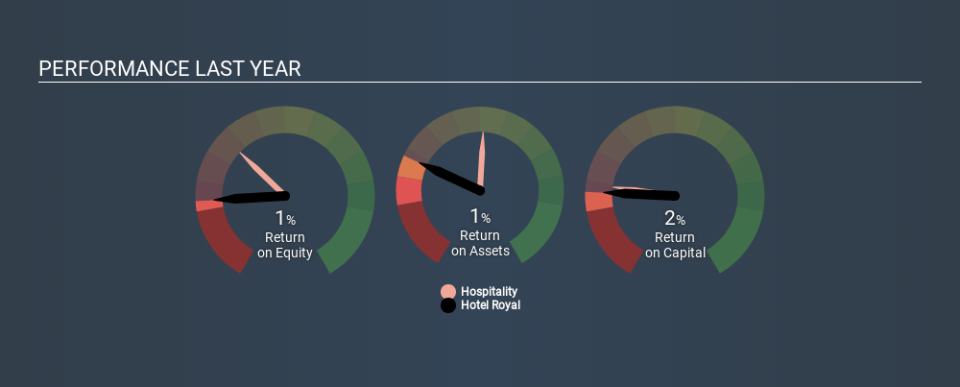
0.015 = S$12m ÷ (S$814m - S$16m) (Based on the trailing twelve months to September 2019.)
Therefore, Hotel Royal has an ROCE of 1.5%.
View our latest analysis for Hotel Royal
Is Hotel Royal's ROCE Good?
ROCE is commonly used for comparing the performance of similar businesses. We can see Hotel Royal's ROCE is meaningfully below the Hospitality industry average of 6.9%. This performance could be negative if sustained, as it suggests the business may underperform its industry. Putting aside Hotel Royal's performance relative to its industry, its ROCE in absolute terms is poor - considering the risk of owning stocks compared to government bonds. It is likely that there are more attractive prospects out there.
Hotel Royal's current ROCE of 1.5% is lower than its ROCE in the past, which was 2.2%, 3 years ago. This makes us wonder if the business is facing new challenges. You can click on the image below to see (in greater detail) how Hotel Royal's past growth compares to other companies.
When considering ROCE, bear in mind that it reflects the past and does not necessarily predict the future. ROCE can be misleading for companies in cyclical industries, with returns looking impressive during the boom times, but very weak during the busts. This is because ROCE only looks at one year, instead of considering returns across a whole cycle. If Hotel Royal is cyclical, it could make sense to check out this free graph of past earnings, revenue and cash flow.
Hotel Royal's Current Liabilities And Their Impact On Its ROCE
Current liabilities include invoices, such as supplier payments, short-term debt, or a tax bill, that need to be paid within 12 months. Due to the way the ROCE equation works, having large bills due in the near term can make it look as though a company has less capital employed, and thus a higher ROCE than usual. To counteract this, we check if a company has high current liabilities, relative to its total assets.
Hotel Royal has total assets of S$814m and current liabilities of S$16m. As a result, its current liabilities are equal to approximately 2.0% of its total assets. Hotel Royal has a low level of current liabilities, which have a negligible impact on its already low ROCE.
What We Can Learn From Hotel Royal's ROCE
Still, investors could probably find more attractive prospects with better performance out there. You might be able to find a better investment than Hotel Royal. If you want a selection of possible winners, check out this free list of interesting companies that trade on a P/E below 20 (but have proven they can grow earnings).
For those who like to find winning investments this free list of growing companies with recent insider purchasing, could be just the ticket.
If you spot an error that warrants correction, please contact the editor at editorial-team@simplywallst.com. This article by Simply Wall St is general in nature. It does not constitute a recommendation to buy or sell any stock, and does not take account of your objectives, or your financial situation. Simply Wall St has no position in the stocks mentioned.
We aim to bring you long-term focused research analysis driven by fundamental data. Note that our analysis may not factor in the latest price-sensitive company announcements or qualitative material. Thank you for reading.
