Why You Should Care About KUKA Aktiengesellschaft’s (ETR:KU2) Low Return On Capital

Today we are going to look at KUKA Aktiengesellschaft (ETR:KU2) to see whether it might be an attractive investment prospect. Specifically, we're going to calculate its Return On Capital Employed (ROCE), in the hopes of getting some insight into the business.
First, we'll go over how we calculate ROCE. Then we'll compare its ROCE to similar companies. And finally, we'll look at how its current liabilities are impacting its ROCE.
What is Return On Capital Employed (ROCE)?
ROCE is a metric for evaluating how much pre-tax income (in percentage terms) a company earns on the capital invested in its business. In general, businesses with a higher ROCE are usually better quality. Overall, it is a valuable metric that has its flaws. Renowned investment researcher Michael Mauboussin has suggested that a high ROCE can indicate that 'one dollar invested in the company generates value of more than one dollar'.
How Do You Calculate Return On Capital Employed?
Analysts use this formula to calculate return on capital employed:
Return on Capital Employed = Earnings Before Interest and Tax (EBIT) ÷ (Total Assets - Current Liabilities)
Or for KUKA:
0.012 = €25m ÷ (€3.5b - €1.4b) (Based on the trailing twelve months to September 2019.)
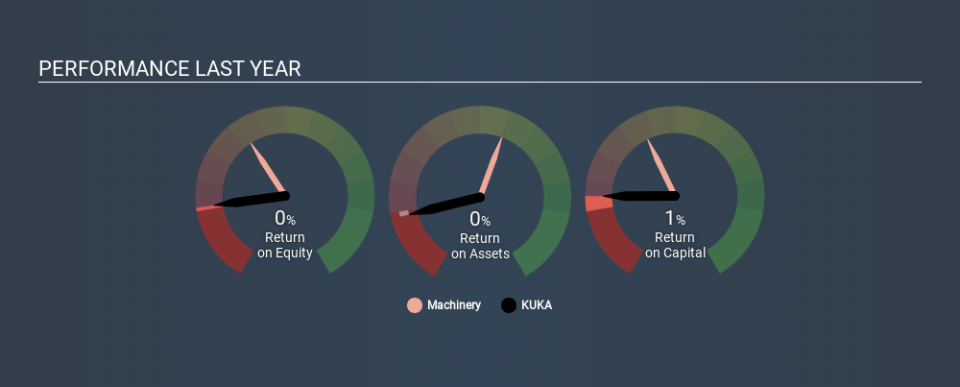
So, KUKA has an ROCE of 1.2%.
Check out our latest analysis for KUKA
Is KUKA's ROCE Good?
ROCE is commonly used for comparing the performance of similar businesses. In this analysis, KUKA's ROCE appears meaningfully below the 9.3% average reported by the Machinery industry. This performance could be negative if sustained, as it suggests the business may underperform its industry. Independently of how KUKA compares to its industry, its ROCE in absolute terms is low; especially compared to the ~-0.4% available in government bonds. Readers may wish to look for more rewarding investments.
We can see that, KUKA currently has an ROCE of 1.2%, less than the 8.9% it reported 3 years ago. This makes us wonder if the business is facing new challenges. You can see in the image below how KUKA's ROCE compares to its industry. Click to see more on past growth.
When considering this metric, keep in mind that it is backwards looking, and not necessarily predictive. Companies in cyclical industries can be difficult to understand using ROCE, as returns typically look high during boom times, and low during busts. ROCE is, after all, simply a snap shot of a single year. Since the future is so important for investors, you should check out our free report on analyst forecasts for KUKA.
How KUKA's Current Liabilities Impact Its ROCE
Liabilities, such as supplier bills and bank overdrafts, are referred to as current liabilities if they need to be paid within 12 months. Due to the way ROCE is calculated, a high level of current liabilities makes a company look as though it has less capital employed, and thus can (sometimes unfairly) boost the ROCE. To counteract this, we check if a company has high current liabilities, relative to its total assets.
KUKA has total assets of €3.5b and current liabilities of €1.4b. Therefore its current liabilities are equivalent to approximately 40% of its total assets. With a medium level of current liabilities boosting the ROCE a little, KUKA's low ROCE is unappealing.
The Bottom Line On KUKA's ROCE
This company may not be the most attractive investment prospect. Of course, you might find a fantastic investment by looking at a few good candidates. So take a peek at this free list of companies with modest (or no) debt, trading on a P/E below 20.
If you are like me, then you will not want to miss this free list of growing companies that insiders are buying.
If you spot an error that warrants correction, please contact the editor at editorial-team@simplywallst.com. This article by Simply Wall St is general in nature. It does not constitute a recommendation to buy or sell any stock, and does not take account of your objectives, or your financial situation. Simply Wall St has no position in the stocks mentioned.
We aim to bring you long-term focused research analysis driven by fundamental data. Note that our analysis may not factor in the latest price-sensitive company announcements or qualitative material. Thank you for reading.

