Why You Should Care About Qube Holdings Limited’s (ASX:QUB) Low Return On Capital

Today we are going to look at Qube Holdings Limited (ASX:QUB) to see whether it might be an attractive investment prospect. To be precise, we'll consider its Return On Capital Employed (ROCE), as that will inform our view of the quality of the business.
First up, we'll look at what ROCE is and how we calculate it. Then we'll compare its ROCE to similar companies. Finally, we'll look at how its current liabilities affect its ROCE.
Understanding Return On Capital Employed (ROCE)
ROCE is a metric for evaluating how much pre-tax income (in percentage terms) a company earns on the capital invested in its business. All else being equal, a better business will have a higher ROCE. Overall, it is a valuable metric that has its flaws. Author Edwin Whiting says to be careful when comparing the ROCE of different businesses, since 'No two businesses are exactly alike.
How Do You Calculate Return On Capital Employed?
Analysts use this formula to calculate return on capital employed:
Return on Capital Employed = Earnings Before Interest and Tax (EBIT) ÷ (Total Assets - Current Liabilities)
Or for Qube Holdings:
0.034 = AU$148m ÷ (AU$4.7b - AU$347m) (Based on the trailing twelve months to June 2019.)
So, Qube Holdings has an ROCE of 3.4%.
View our latest analysis for Qube Holdings
Is Qube Holdings's ROCE Good?
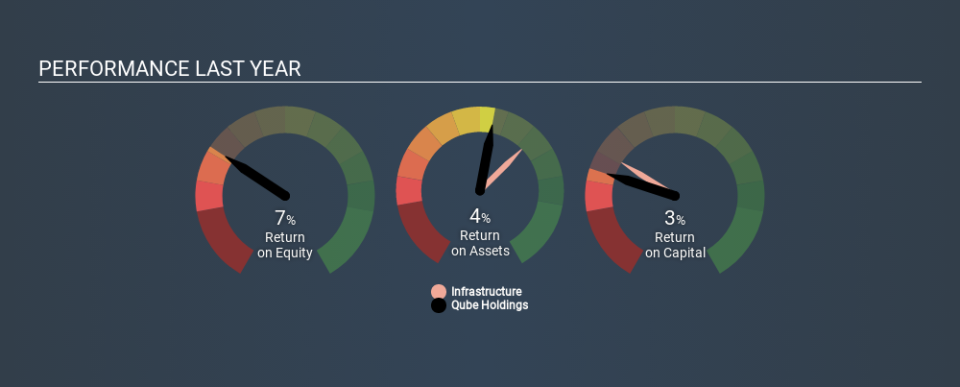
One way to assess ROCE is to compare similar companies. We can see Qube Holdings's ROCE is meaningfully below the Infrastructure industry average of 5.5%. This could be seen as a negative, as it suggests some competitors may be employing their capital more efficiently. Putting aside Qube Holdings's performance relative to its industry, its ROCE in absolute terms is poor - considering the risk of owning stocks compared to government bonds. There are potentially more appealing investments elsewhere.
We can see that, Qube Holdings currently has an ROCE of 3.4%, less than the 5.0% it reported 3 years ago. So investors might consider if it has had issues recently. You can see in the image below how Qube Holdings's ROCE compares to its industry. Click to see more on past growth.
When considering ROCE, bear in mind that it reflects the past and does not necessarily predict the future. ROCE can be deceptive for cyclical businesses, as returns can look incredible in boom times, and terribly low in downturns. ROCE is only a point-in-time measure. Since the future is so important for investors, you should check out our free report on analyst forecasts for Qube Holdings.
How Qube Holdings's Current Liabilities Impact Its ROCE
Current liabilities include invoices, such as supplier payments, short-term debt, or a tax bill, that need to be paid within 12 months. Due to the way the ROCE equation works, having large bills due in the near term can make it look as though a company has less capital employed, and thus a higher ROCE than usual. To check the impact of this, we calculate if a company has high current liabilities relative to its total assets.
Qube Holdings has total liabilities of AU$347m and total assets of AU$4.7b. As a result, its current liabilities are equal to approximately 7.3% of its total assets. Qube Holdings has very few current liabilities, which have a minimal effect on its already low ROCE.
Our Take On Qube Holdings's ROCE
Still, investors could probably find more attractive prospects with better performance out there. You might be able to find a better investment than Qube Holdings. If you want a selection of possible winners, check out this free list of interesting companies that trade on a P/E below 20 (but have proven they can grow earnings).
For those who like to find winning investments this free list of growing companies with recent insider purchasing, could be just the ticket.
If you spot an error that warrants correction, please contact the editor at editorial-team@simplywallst.com. This article by Simply Wall St is general in nature. It does not constitute a recommendation to buy or sell any stock, and does not take account of your objectives, or your financial situation. Simply Wall St has no position in the stocks mentioned.
We aim to bring you long-term focused research analysis driven by fundamental data. Note that our analysis may not factor in the latest price-sensitive company announcements or qualitative material. Thank you for reading.

