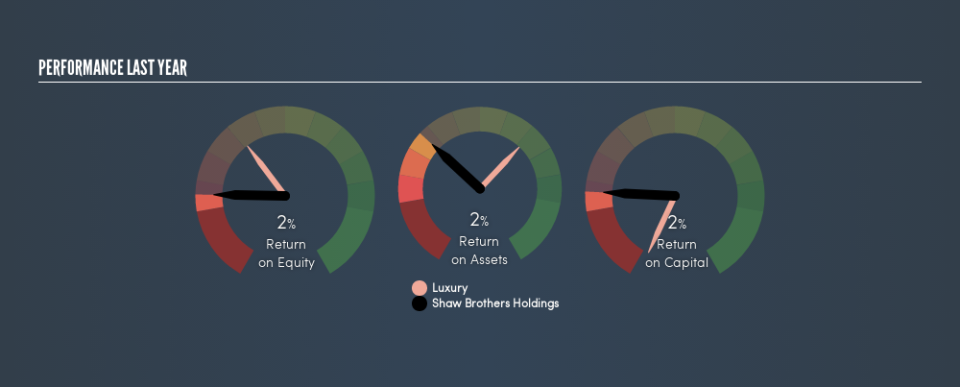
Why You Should Care About Shaw Brothers Holdings Limited’s (HKG:953) Low Return On Capital

Today we'll evaluate Shaw Brothers Holdings Limited (HKG:953) to determine whether it could have potential as an investment idea. Specifically, we're going to calculate its Return On Capital Employed (ROCE), in the hopes of getting some insight into the business.
First of all, we'll work out how to calculate ROCE. Second, we'll look at its ROCE compared to similar companies. And finally, we'll look at how its current liabilities are impacting its ROCE.
What is Return On Capital Employed (ROCE)?
ROCE measures the 'return' (pre-tax profit) a company generates from capital employed in its business. All else being equal, a better business will have a higher ROCE. In brief, it is a useful tool, but it is not without drawbacks. Renowned investment researcher Michael Mauboussin has suggested that a high ROCE can indicate that 'one dollar invested in the company generates value of more than one dollar'.
So, How Do We Calculate ROCE?
Analysts use this formula to calculate return on capital employed:
Return on Capital Employed = Earnings Before Interest and Tax (EBIT) ÷ (Total Assets - Current Liabilities)
Or for Shaw Brothers Holdings:
0.015 = CN¥6.4m ÷ (CN¥460m - CN¥47m) (Based on the trailing twelve months to December 2018.)
So, Shaw Brothers Holdings has an ROCE of 1.5%.
See our latest analysis for Shaw Brothers Holdings
Does Shaw Brothers Holdings Have A Good ROCE?
ROCE is commonly used for comparing the performance of similar businesses. Using our data, Shaw Brothers Holdings's ROCE appears to be significantly below the 9.8% average in the Luxury industry. This could be seen as a negative, as it suggests some competitors may be employing their capital more efficiently. Regardless of how Shaw Brothers Holdings stacks up against its industry, its ROCE in absolute terms is quite low (especially compared to a bank account). It is likely that there are more attractive prospects out there.
Shaw Brothers Holdings has an ROCE of 1.5%, but it didn't have an ROCE 3 years ago, since it was unprofitable. This makes us wonder if the company is improving.
Remember that this metric is backwards looking - it shows what has happened in the past, and does not accurately predict the future. ROCE can be misleading for companies in cyclical industries, with returns looking impressive during the boom times, but very weak during the busts. ROCE is only a point-in-time measure. If Shaw Brothers Holdings is cyclical, it could make sense to check out this free graph of past earnings, revenue and cash flow.
Shaw Brothers Holdings's Current Liabilities And Their Impact On Its ROCE
Current liabilities include invoices, such as supplier payments, short-term debt, or a tax bill, that need to be paid within 12 months. The ROCE equation subtracts current liabilities from capital employed, so a company with a lot of current liabilities appears to have less capital employed, and a higher ROCE than otherwise. To counteract this, we check if a company has high current liabilities, relative to its total assets.
Shaw Brothers Holdings has total assets of CN¥460m and current liabilities of CN¥47m. Therefore its current liabilities are equivalent to approximately 10% of its total assets. This is not a high level of current liabilities, which would not boost the ROCE by much.
What We Can Learn From Shaw Brothers Holdings's ROCE
While that is good to see, Shaw Brothers Holdings has a low ROCE and does not look attractive in this analysis. But note: make sure you look for a great company, not just the first idea you come across. So take a peek at this free list of interesting companies with strong recent earnings growth (and a P/E ratio below 20).
If you like to buy stocks alongside management, then you might just love this free list of companies. (Hint: insiders have been buying them).
We aim to bring you long-term focused research analysis driven by fundamental data. Note that our analysis may not factor in the latest price-sensitive company announcements or qualitative material.
If you spot an error that warrants correction, please contact the editor at editorial-team@simplywallst.com. This article by Simply Wall St is general in nature. It does not constitute a recommendation to buy or sell any stock, and does not take account of your objectives, or your financial situation. Simply Wall St has no position in the stocks mentioned. Thank you for reading.

