Why Ceridian HCM Holding Inc.’s (NYSE:CDAY) Return On Capital Employed Might Be A Concern

Today we'll evaluate Ceridian HCM Holding Inc. (NYSE:CDAY) to determine whether it could have potential as an investment idea. Specifically, we'll consider its Return On Capital Employed (ROCE), since that will give us an insight into how efficiently the business can generate profits from the capital it requires.
First up, we'll look at what ROCE is and how we calculate it. Then we'll compare its ROCE to similar companies. Finally, we'll look at how its current liabilities affect its ROCE.
Understanding Return On Capital Employed (ROCE)
ROCE measures the 'return' (pre-tax profit) a company generates from capital employed in its business. Generally speaking a higher ROCE is better. Ultimately, it is a useful but imperfect metric. Author Edwin Whiting says to be careful when comparing the ROCE of different businesses, since 'No two businesses are exactly alike.
How Do You Calculate Return On Capital Employed?
The formula for calculating the return on capital employed is:
Return on Capital Employed = Earnings Before Interest and Tax (EBIT) ÷ (Total Assets - Current Liabilities)
Or for Ceridian HCM Holding:
0.027 = US$72m ÷ (US$5.4b - US$2.7b) (Based on the trailing twelve months to September 2019.)
Therefore, Ceridian HCM Holding has an ROCE of 2.7%.
Check out our latest analysis for Ceridian HCM Holding
Is Ceridian HCM Holding's ROCE Good?
When making comparisons between similar businesses, investors may find ROCE useful. Using our data, Ceridian HCM Holding's ROCE appears to be significantly below the 9.9% average in the Software industry. This could be seen as a negative, as it suggests some competitors may be employing their capital more efficiently. Regardless of how Ceridian HCM Holding stacks up against its industry, its ROCE in absolute terms is quite low (especially compared to a bank account). There are potentially more appealing investments elsewhere.
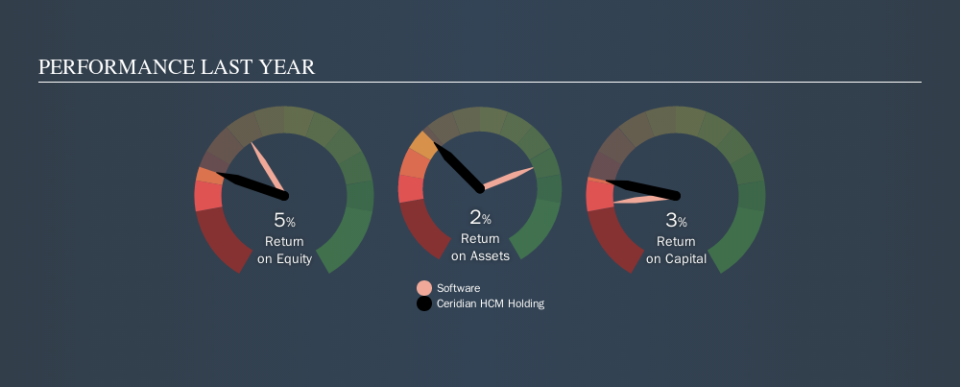
Our data shows that Ceridian HCM Holding currently has an ROCE of 2.7%, compared to its ROCE of 0.5% 3 years ago. This makes us wonder if the company is improving. The image below shows how Ceridian HCM Holding's ROCE compares to its industry, and you can click it to see more detail on its past growth.
Remember that this metric is backwards looking - it shows what has happened in the past, and does not accurately predict the future. Companies in cyclical industries can be difficult to understand using ROCE, as returns typically look high during boom times, and low during busts. This is because ROCE only looks at one year, instead of considering returns across a whole cycle. Since the future is so important for investors, you should check out our free report on analyst forecasts for Ceridian HCM Holding.
Do Ceridian HCM Holding's Current Liabilities Skew Its ROCE?
Short term (or current) liabilities, are things like supplier invoices, overdrafts, or tax bills that need to be paid within 12 months. The ROCE equation subtracts current liabilities from capital employed, so a company with a lot of current liabilities appears to have less capital employed, and a higher ROCE than otherwise. To counter this, investors can check if a company has high current liabilities relative to total assets.
Ceridian HCM Holding has total liabilities of US$2.7b and total assets of US$5.4b. As a result, its current liabilities are equal to approximately 50% of its total assets. Ceridian HCM Holding has a fairly high level of current liabilities, boosting its ROCE.
The Bottom Line On Ceridian HCM Holding's ROCE
Unfortunately, its ROCE is also pretty low, so we are cautious about the stock. You might be able to find a better investment than Ceridian HCM Holding. If you want a selection of possible winners, check out this free list of interesting companies that trade on a P/E below 20 (but have proven they can grow earnings).
If you are like me, then you will not want to miss this free list of growing companies that insiders are buying.
We aim to bring you long-term focused research analysis driven by fundamental data. Note that our analysis may not factor in the latest price-sensitive company announcements or qualitative material.
If you spot an error that warrants correction, please contact the editor at editorial-team@simplywallst.com. This article by Simply Wall St is general in nature. It does not constitute a recommendation to buy or sell any stock, and does not take account of your objectives, or your financial situation. Simply Wall St has no position in the stocks mentioned. Thank you for reading.

