Why CNA Financial Corporation's (NYSE:CNA) High P/E Ratio Isn't Necessarily A Bad Thing

Today, we'll introduce the concept of the P/E ratio for those who are learning about investing. To keep it practical, we'll show how CNA Financial Corporation's (NYSE:CNA) P/E ratio could help you assess the value on offer. What is CNA Financial's P/E ratio? Well, based on the last twelve months it is 18.50. That means that at current prices, buyers pay $18.50 for every $1 in trailing yearly profits.
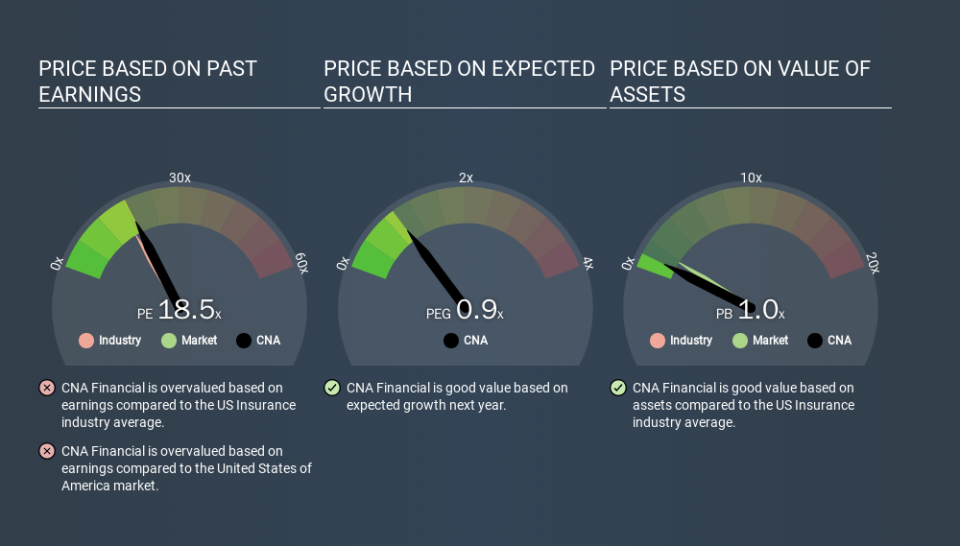
Check out our latest analysis for CNA Financial
How Do You Calculate CNA Financial's P/E Ratio?
The formula for P/E is:
Price to Earnings Ratio = Share Price ÷ Earnings per Share (EPS)
Or for CNA Financial:
P/E of 18.50 = $43.81 ÷ $2.37 (Based on the year to September 2019.)
Is A High Price-to-Earnings Ratio Good?
A higher P/E ratio means that buyers have to pay a higher price for each $1 the company has earned over the last year. That isn't necessarily good or bad, but a high P/E implies relatively high expectations of what a company can achieve in the future.
Does CNA Financial Have A Relatively High Or Low P/E For Its Industry?
One good way to get a quick read on what market participants expect of a company is to look at its P/E ratio. The image below shows that CNA Financial has a higher P/E than the average (16.7) P/E for companies in the insurance industry.
CNA Financial's P/E tells us that market participants think the company will perform better than its industry peers, going forward. Clearly the market expects growth, but it isn't guaranteed. So further research is always essential. I often monitor director buying and selling.
How Growth Rates Impact P/E Ratios
P/E ratios primarily reflect market expectations around earnings growth rates. If earnings are growing quickly, then the 'E' in the equation will increase faster than it would otherwise. Therefore, even if you pay a high multiple of earnings now, that multiple will become lower in the future. A lower P/E should indicate the stock is cheap relative to others -- and that may attract buyers.
CNA Financial's earnings per share fell by 43% in the last twelve months. But EPS is up 5.3% over the last 3 years. And it has shrunk its earnings per share by 6.7% per year over the last five years. This might lead to muted expectations.
Remember: P/E Ratios Don't Consider The Balance Sheet
The 'Price' in P/E reflects the market capitalization of the company. Thus, the metric does not reflect cash or debt held by the company. Hypothetically, a company could reduce its future P/E ratio by spending its cash (or taking on debt) to achieve higher earnings.
While growth expenditure doesn't always pay off, the point is that it is a good option to have; but one that the P/E ratio ignores.
Is Debt Impacting CNA Financial's P/E?
CNA Financial has net debt worth just 7.2% of its market capitalization. So it doesn't have as many options as it would with net cash, but its debt would not have much of an impact on its P/E ratio.
The Bottom Line On CNA Financial's P/E Ratio
CNA Financial trades on a P/E ratio of 18.5, which is fairly close to the US market average of 18.5. With modest debt, and a lack of recent growth, it would seem the market is expecting improvement in earnings.
Investors should be looking to buy stocks that the market is wrong about. If the reality for a company is better than it expects, you can make money by buying and holding for the long term. So this free visual report on analyst forecasts could hold the key to an excellent investment decision.
Of course, you might find a fantastic investment by looking at a few good candidates. So take a peek at this free list of companies with modest (or no) debt, trading on a P/E below 20.
If you spot an error that warrants correction, please contact the editor at editorial-team@simplywallst.com. This article by Simply Wall St is general in nature. It does not constitute a recommendation to buy or sell any stock, and does not take account of your objectives, or your financial situation. Simply Wall St has no position in the stocks mentioned.
We aim to bring you long-term focused research analysis driven by fundamental data. Note that our analysis may not factor in the latest price-sensitive company announcements or qualitative material. Thank you for reading.
