Why Cogobuy Group’s (HKG:400) Return On Capital Employed Might Be A Concern

Today we'll look at Cogobuy Group (HKG:400) and reflect on its potential as an investment. Specifically, we'll consider its Return On Capital Employed (ROCE), since that will give us an insight into how efficiently the business can generate profits from the capital it requires.
First, we'll go over how we calculate ROCE. Second, we'll look at its ROCE compared to similar companies. And finally, we'll look at how its current liabilities are impacting its ROCE.
Understanding Return On Capital Employed (ROCE)
ROCE measures the amount of pre-tax profits a company can generate from the capital employed in its business. All else being equal, a better business will have a higher ROCE. Overall, it is a valuable metric that has its flaws. Renowned investment researcher Michael Mauboussin has suggested that a high ROCE can indicate that 'one dollar invested in the company generates value of more than one dollar'.
So, How Do We Calculate ROCE?
The formula for calculating the return on capital employed is:
Return on Capital Employed = Earnings Before Interest and Tax (EBIT) ÷ (Total Assets - Current Liabilities)
Or for Cogobuy Group:
0.016 = CN¥70m ÷ (CN¥6.2b - CN¥1.9b) (Based on the trailing twelve months to June 2019.)
Therefore, Cogobuy Group has an ROCE of 1.6%.
View our latest analysis for Cogobuy Group
Does Cogobuy Group Have A Good ROCE?
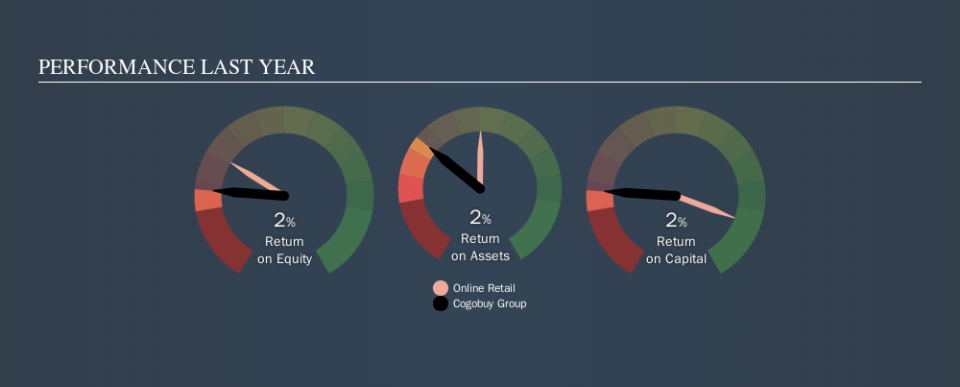
ROCE is commonly used for comparing the performance of similar businesses. We can see Cogobuy Group's ROCE is meaningfully below the Online Retail industry average of 6.3%. This could be seen as a negative, as it suggests some competitors may be employing their capital more efficiently. Independently of how Cogobuy Group compares to its industry, its ROCE in absolute terms is low; especially compared to the ~2.0% available in government bonds. There are potentially more appealing investments elsewhere.
We can see that, Cogobuy Group currently has an ROCE of 1.6%, less than the 25% it reported 3 years ago. Therefore we wonder if the company is facing new headwinds. You can see in the image below how Cogobuy Group's ROCE compares to its industry. Click to see more on past growth.
When considering this metric, keep in mind that it is backwards looking, and not necessarily predictive. ROCE can be deceptive for cyclical businesses, as returns can look incredible in boom times, and terribly low in downturns. This is because ROCE only looks at one year, instead of considering returns across a whole cycle. What happens in the future is pretty important for investors, so we have prepared a free report on analyst forecasts for Cogobuy Group.
Cogobuy Group's Current Liabilities And Their Impact On Its ROCE
Current liabilities include invoices, such as supplier payments, short-term debt, or a tax bill, that need to be paid within 12 months. Due to the way ROCE is calculated, a high level of current liabilities makes a company look as though it has less capital employed, and thus can (sometimes unfairly) boost the ROCE. To counter this, investors can check if a company has high current liabilities relative to total assets.
Cogobuy Group has total liabilities of CN¥1.9b and total assets of CN¥6.2b. Therefore its current liabilities are equivalent to approximately 31% of its total assets. In light of sufficient current liabilities to noticeably boost the ROCE, Cogobuy Group's ROCE is concerning.
What We Can Learn From Cogobuy Group's ROCE
This company may not be the most attractive investment prospect. Of course, you might find a fantastic investment by looking at a few good candidates. So take a peek at this free list of companies with modest (or no) debt, trading on a P/E below 20.
If you like to buy stocks alongside management, then you might just love this free list of companies. (Hint: insiders have been buying them).
We aim to bring you long-term focused research analysis driven by fundamental data. Note that our analysis may not factor in the latest price-sensitive company announcements or qualitative material.
If you spot an error that warrants correction, please contact the editor at editorial-team@simplywallst.com. This article by Simply Wall St is general in nature. It does not constitute a recommendation to buy or sell any stock, and does not take account of your objectives, or your financial situation. Simply Wall St has no position in the stocks mentioned. Thank you for reading.

