
Why Dynagreen Environmental Protection Group Co., Ltd.’s (HKG:1330) Return On Capital Employed Looks Uninspiring

Today we are going to look at Dynagreen Environmental Protection Group Co., Ltd. (HKG:1330) to see whether it might be an attractive investment prospect. Specifically, we're going to calculate its Return On Capital Employed (ROCE), in the hopes of getting some insight into the business.
Firstly, we'll go over how we calculate ROCE. Next, we'll compare it to others in its industry. Then we'll determine how its current liabilities are affecting its ROCE.
Understanding Return On Capital Employed (ROCE)
ROCE measures the 'return' (pre-tax profit) a company generates from capital employed in its business. All else being equal, a better business will have a higher ROCE. Overall, it is a valuable metric that has its flaws. Renowned investment researcher Michael Mauboussin has suggested that a high ROCE can indicate that 'one dollar invested in the company generates value of more than one dollar'.
So, How Do We Calculate ROCE?
Analysts use this formula to calculate return on capital employed:
Return on Capital Employed = Earnings Before Interest and Tax (EBIT) ÷ (Total Assets - Current Liabilities)
Or for Dynagreen Environmental Protection Group:
0.071 = CN¥584m ÷ (CN¥12b - CN¥4.0b) (Based on the trailing twelve months to June 2019.)
So, Dynagreen Environmental Protection Group has an ROCE of 7.1%.
Check out our latest analysis for Dynagreen Environmental Protection Group
Does Dynagreen Environmental Protection Group Have A Good ROCE?
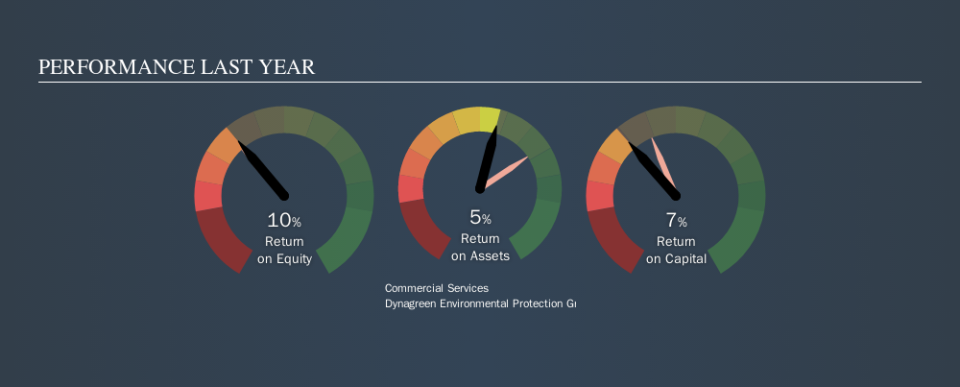
One way to assess ROCE is to compare similar companies. We can see Dynagreen Environmental Protection Group's ROCE is meaningfully below the Commercial Services industry average of 9.9%. This performance could be negative if sustained, as it suggests the business may underperform its industry. Aside from the industry comparison, Dynagreen Environmental Protection Group's ROCE is mediocre in absolute terms, considering the risk of investing in stocks versus the safety of a bank account. Investors may wish to consider higher-performing investments.
The image below shows how Dynagreen Environmental Protection Group's ROCE compares to its industry, and you can click it to see more detail on its past growth.
Remember that this metric is backwards looking - it shows what has happened in the past, and does not accurately predict the future. Companies in cyclical industries can be difficult to understand using ROCE, as returns typically look high during boom times, and low during busts. ROCE is only a point-in-time measure. Since the future is so important for investors, you should check out our free report on analyst forecasts for Dynagreen Environmental Protection Group.
What Are Current Liabilities, And How Do They Affect Dynagreen Environmental Protection Group's ROCE?
Current liabilities are short term bills and invoices that need to be paid in 12 months or less. Due to the way ROCE is calculated, a high level of current liabilities makes a company look as though it has less capital employed, and thus can (sometimes unfairly) boost the ROCE. To counter this, investors can check if a company has high current liabilities relative to total assets.
Dynagreen Environmental Protection Group has total liabilities of CN¥4.0b and total assets of CN¥12b. As a result, its current liabilities are equal to approximately 33% of its total assets. Dynagreen Environmental Protection Group has a medium level of current liabilities, which would boost its ROCE somewhat.
The Bottom Line On Dynagreen Environmental Protection Group's ROCE
Despite this, its ROCE is still mediocre, and you may find more appealing investments elsewhere. You might be able to find a better investment than Dynagreen Environmental Protection Group. If you want a selection of possible winners, check out this free list of interesting companies that trade on a P/E below 20 (but have proven they can grow earnings).
If you like to buy stocks alongside management, then you might just love this free list of companies. (Hint: insiders have been buying them).
We aim to bring you long-term focused research analysis driven by fundamental data. Note that our analysis may not factor in the latest price-sensitive company announcements or qualitative material.
If you spot an error that warrants correction, please contact the editor at editorial-team@simplywallst.com. This article by Simply Wall St is general in nature. It does not constitute a recommendation to buy or sell any stock, and does not take account of your objectives, or your financial situation. Simply Wall St has no position in the stocks mentioned. Thank you for reading.
