Why EL. D. Mouzakis S.A.’s (ATH:MOYZK) Use Of Investor Capital Doesn’t Look Great

Today we'll look at EL. D. Mouzakis S.A. (ATH:MOYZK) and reflect on its potential as an investment. Specifically, we're going to calculate its Return On Capital Employed (ROCE), in the hopes of getting some insight into the business.
Firstly, we'll go over how we calculate ROCE. Then we'll compare its ROCE to similar companies. And finally, we'll look at how its current liabilities are impacting its ROCE.
Return On Capital Employed (ROCE): What is it?
ROCE measures the 'return' (pre-tax profit) a company generates from capital employed in its business. All else being equal, a better business will have a higher ROCE. In brief, it is a useful tool, but it is not without drawbacks. Renowned investment researcher Michael Mauboussin has suggested that a high ROCE can indicate that 'one dollar invested in the company generates value of more than one dollar'.
So, How Do We Calculate ROCE?
The formula for calculating the return on capital employed is:
Return on Capital Employed = Earnings Before Interest and Tax (EBIT) ÷ (Total Assets - Current Liabilities)
Or for EL. D. Mouzakis:
0.0062 = €356k ÷ (€59m - €1.7m) (Based on the trailing twelve months to December 2018.)
So, EL. D. Mouzakis has an ROCE of 0.6%.
Want to participate in a short research study? Help shape the future of investing tools and you could win a $250 gift card!
View our latest analysis for EL. D. Mouzakis
Is EL. D. Mouzakis's ROCE Good?
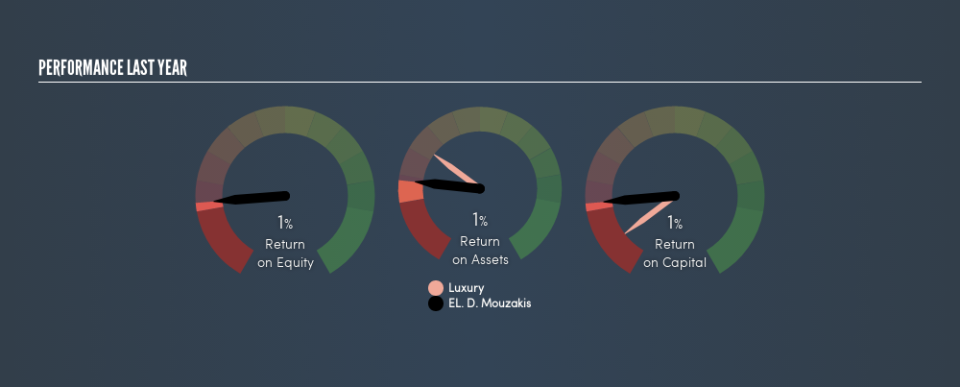
When making comparisons between similar businesses, investors may find ROCE useful. Using our data, EL. D. Mouzakis's ROCE appears to be significantly below the 2.0% average in the Luxury industry. This performance is not ideal, as it suggests the company may not be deploying its capital as effectively as some competitors. Putting aside EL. D. Mouzakis's performance relative to its industry, its ROCE in absolute terms is poor - considering the risk of owning stocks compared to government bonds. There are potentially more appealing investments elsewhere.
EL. D. Mouzakis reported an ROCE of 0.6% -- better than 3 years ago, when the company didn't make a profit. This makes us wonder if the company is improving.
Remember that this metric is backwards looking - it shows what has happened in the past, and does not accurately predict the future. ROCE can be misleading for companies in cyclical industries, with returns looking impressive during the boom times, but very weak during the busts. ROCE is only a point-in-time measure. How cyclical is EL. D. Mouzakis? You can see for yourself by looking at this free graph of past earnings, revenue and cash flow.
What Are Current Liabilities, And How Do They Affect EL. D. Mouzakis's ROCE?
Current liabilities include invoices, such as supplier payments, short-term debt, or a tax bill, that need to be paid within 12 months. The ROCE equation subtracts current liabilities from capital employed, so a company with a lot of current liabilities appears to have less capital employed, and a higher ROCE than otherwise. To check the impact of this, we calculate if a company has high current liabilities relative to its total assets.
EL. D. Mouzakis has total liabilities of €1.7m and total assets of €59m. Therefore its current liabilities are equivalent to approximately 2.8% of its total assets. EL. D. Mouzakis has a low level of current liabilities, which have a negligible impact on its already low ROCE.
What We Can Learn From EL. D. Mouzakis's ROCE
Nevertheless, there are potentially more attractive companies to invest in. You might be able to find a better investment than EL. D. Mouzakis. If you want a selection of possible winners, check out this free list of interesting companies that trade on a P/E below 20 (but have proven they can grow earnings).
For those who like to find winning investments this free list of growing companies with recent insider purchasing, could be just the ticket.
We aim to bring you long-term focused research analysis driven by fundamental data. Note that our analysis may not factor in the latest price-sensitive company announcements or qualitative material.
If you spot an error that warrants correction, please contact the editor at editorial-team@simplywallst.com. This article by Simply Wall St is general in nature. It does not constitute a recommendation to buy or sell any stock, and does not take account of your objectives, or your financial situation. Simply Wall St has no position in the stocks mentioned. Thank you for reading.

