Why Energy Recovery, Inc.'s (NASDAQ:ERII) High P/E Ratio Isn't Necessarily A Bad Thing

This article is for investors who would like to improve their understanding of price to earnings ratios (P/E ratios). We'll show how you can use Energy Recovery, Inc.'s (NASDAQ:ERII) P/E ratio to inform your assessment of the investment opportunity. Energy Recovery has a price to earnings ratio of 40.21, based on the last twelve months. That is equivalent to an earnings yield of about 2.5%.
See our latest analysis for Energy Recovery
How Do I Calculate A Price To Earnings Ratio?
The formula for price to earnings is:
Price to Earnings Ratio = Price per Share ÷ Earnings per Share (EPS)
Or for Energy Recovery:
P/E of 40.21 = USD10.30 ÷ USD0.26 (Based on the year to September 2019.)
Is A High Price-to-Earnings Ratio Good?
A higher P/E ratio means that investors are paying a higher price for each USD1 of company earnings. That isn't necessarily good or bad, but a high P/E implies relatively high expectations of what a company can achieve in the future.
How Does Energy Recovery's P/E Ratio Compare To Its Peers?
The P/E ratio essentially measures market expectations of a company. The image below shows that Energy Recovery has a higher P/E than the average (22.5) P/E for companies in the machinery industry.
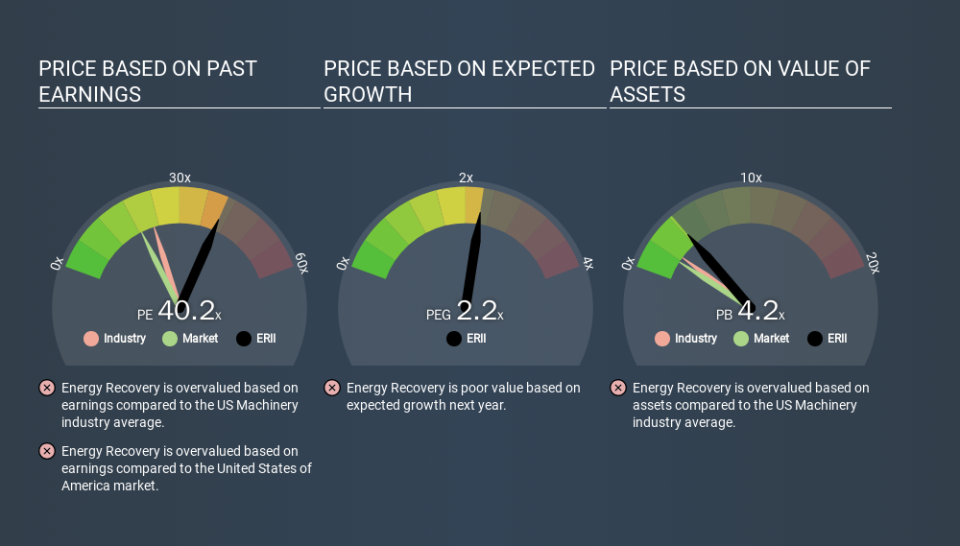
That means that the market expects Energy Recovery will outperform other companies in its industry. Clearly the market expects growth, but it isn't guaranteed. So investors should always consider the P/E ratio alongside other factors, such as whether company directors have been buying shares.
How Growth Rates Impact P/E Ratios
Generally speaking the rate of earnings growth has a profound impact on a company's P/E multiple. Earnings growth means that in the future the 'E' will be higher. Therefore, even if you pay a high multiple of earnings now, that multiple will become lower in the future. And as that P/E ratio drops, the company will look cheap, unless its share price increases.
Energy Recovery saw earnings per share decrease by 59% last year.
Don't Forget: The P/E Does Not Account For Debt or Bank Deposits
The 'Price' in P/E reflects the market capitalization of the company. That means it doesn't take debt or cash into account. Theoretically, a business can improve its earnings (and produce a lower P/E in the future) by investing in growth. That means taking on debt (or spending its cash).
Such expenditure might be good or bad, in the long term, but the point here is that the balance sheet is not reflected by this ratio.
Is Debt Impacting Energy Recovery's P/E?
Energy Recovery has net cash of US$90m. This is fairly high at 16% of its market capitalization. That might mean balance sheet strength is important to the business, but should also help push the P/E a bit higher than it would otherwise be.
The Bottom Line On Energy Recovery's P/E Ratio
Energy Recovery trades on a P/E ratio of 40.2, which is above its market average of 18.6. Falling earnings per share is probably keeping traditional value investors away, but the net cash position means the company has time to improve: and the high P/E suggests the market thinks it will.
Investors should be looking to buy stocks that the market is wrong about. As value investor Benjamin Graham famously said, 'In the short run, the market is a voting machine but in the long run, it is a weighing machine. So this free report on the analyst consensus forecasts could help you make a master move on this stock.
Of course, you might find a fantastic investment by looking at a few good candidates. So take a peek at this free list of companies with modest (or no) debt, trading on a P/E below 20.
If you spot an error that warrants correction, please contact the editor at editorial-team@simplywallst.com. This article by Simply Wall St is general in nature. It does not constitute a recommendation to buy or sell any stock, and does not take account of your objectives, or your financial situation. Simply Wall St has no position in the stocks mentioned.
We aim to bring you long-term focused research analysis driven by fundamental data. Note that our analysis may not factor in the latest price-sensitive company announcements or qualitative material. Thank you for reading.
