Why We Like The Environmental Group Limited’s (ASX:EGL) 14% Return On Capital Employed

Want to participate in a short research study? Help shape the future of investing tools and you could win a $250 gift card!
Today we are going to look at The Environmental Group Limited (ASX:EGL) to see whether it might be an attractive investment prospect. In particular, we’ll consider its Return On Capital Employed (ROCE), as that can give us insight into how profitably the company is able to employ capital in its business.
First up, we’ll look at what ROCE is and how we calculate it. Second, we’ll look at its ROCE compared to similar companies. Then we’ll determine how its current liabilities are affecting its ROCE.
What is Return On Capital Employed (ROCE)?
ROCE measures the ‘return’ (pre-tax profit) a company generates from capital employed in its business. Generally speaking a higher ROCE is better. In brief, it is a useful tool, but it is not without drawbacks. Renowned investment researcher Michael Mauboussin has suggested that a high ROCE can indicate that ‘one dollar invested in the company generates value of more than one dollar’.
How Do You Calculate Return On Capital Employed?
The formula for calculating the return on capital employed is:
Return on Capital Employed = Earnings Before Interest and Tax (EBIT) ÷ (Total Assets – Current Liabilities)
Or for Environmental Group:
0.14 = AU$2.1m ÷ (AU$21m – AU$5.7m) (Based on the trailing twelve months to June 2018.)
Therefore, Environmental Group has an ROCE of 14%.
View our latest analysis for Environmental Group
Is Environmental Group’s ROCE Good?
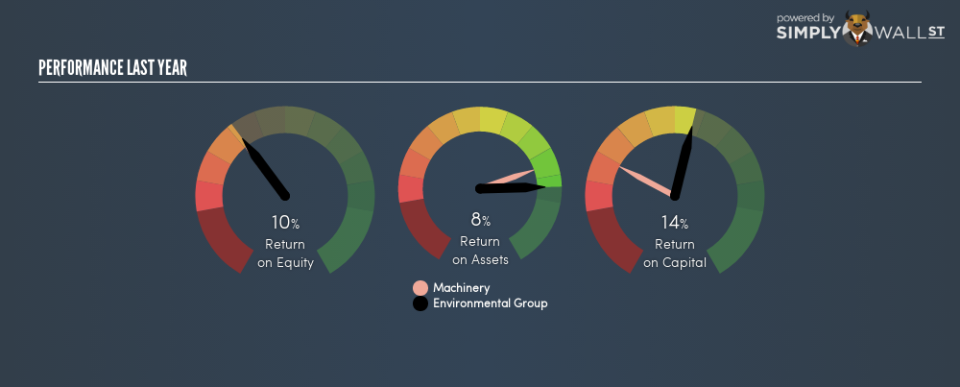
When making comparisons between similar businesses, investors may find ROCE useful. In our analysis, Environmental Group’s ROCE is meaningfully higher than the 8.9% average in the Machinery industry. I think that’s good to see, since it implies the company is better than other companies at making the most of its capital. Independently of how Environmental Group compares to its industry, its ROCE in absolute terms appears decent, and the company may be worthy of closer investigation.
Our data shows that Environmental Group currently has an ROCE of 14%, compared to its ROCE of 4.6% 3 years ago. This makes us think about whether the company has been reinvesting shrewdly.
When considering this metric, keep in mind that it is backwards looking, and not necessarily predictive. ROCE can be misleading for companies in cyclical industries, with returns looking impressive during the boom times, but very weak during the busts. This is because ROCE only looks at one year, instead of considering returns across a whole cycle. If Environmental Group is cyclical, it could make sense to check out this free graph of past earnings, revenue and cash flow.
Environmental Group’s Current Liabilities And Their Impact On Its ROCE
Current liabilities include invoices, such as supplier payments, short-term debt, or a tax bill, that need to be paid within 12 months. Due to the way ROCE is calculated, a high level of current liabilities makes a company look as though it has less capital employed, and thus can (sometimes unfairly) boost the ROCE. To check the impact of this, we calculate if a company has high current liabilities relative to its total assets.
Environmental Group has total liabilities of AU$5.7m and total assets of AU$21m. Therefore its current liabilities are equivalent to approximately 27% of its total assets. A fairly low level of current liabilities is not influencing the ROCE too much.
What We Can Learn From Environmental Group’s ROCE
Overall, Environmental Group has a decent ROCE and could be worthy of further research. But note: Environmental Group may not be the best stock to buy. So take a peek at this free list of interesting companies with strong recent earnings growth (and a P/E ratio below 20).
For those who like to find winning investments this free list of growing companies with recent insider purchasing, could be just the ticket.
To help readers see past the short term volatility of the financial market, we aim to bring you a long-term focused research analysis purely driven by fundamental data. Note that our analysis does not factor in the latest price-sensitive company announcements.
The author is an independent contributor and at the time of publication had no position in the stocks mentioned. For errors that warrant correction please contact the editor at editorial-team@simplywallst.com.
