Why Fraser and Neave, Limited’s (SGX:F99) Use Of Investor Capital Doesn’t Look Great

Today we are going to look at Fraser and Neave, Limited (SGX:F99) to see whether it might be an attractive investment prospect. To be precise, we'll consider its Return On Capital Employed (ROCE), as that will inform our view of the quality of the business.
First, we'll go over how we calculate ROCE. Then we'll compare its ROCE to similar companies. Last but not least, we'll look at what impact its current liabilities have on its ROCE.
Understanding Return On Capital Employed (ROCE)
ROCE measures the amount of pre-tax profits a company can generate from the capital employed in its business. All else being equal, a better business will have a higher ROCE. Ultimately, it is a useful but imperfect metric. Renowned investment researcher Michael Mauboussin has suggested that a high ROCE can indicate that 'one dollar invested in the company generates value of more than one dollar'.
So, How Do We Calculate ROCE?
The formula for calculating the return on capital employed is:
Return on Capital Employed = Earnings Before Interest and Tax (EBIT) ÷ (Total Assets - Current Liabilities)
Or for Fraser and Neave:
0.036 = S$155m ÷ (S$4.8b - S$521m) (Based on the trailing twelve months to December 2019.)
Therefore, Fraser and Neave has an ROCE of 3.6%.
Check out our latest analysis for Fraser and Neave
Is Fraser and Neave's ROCE Good?
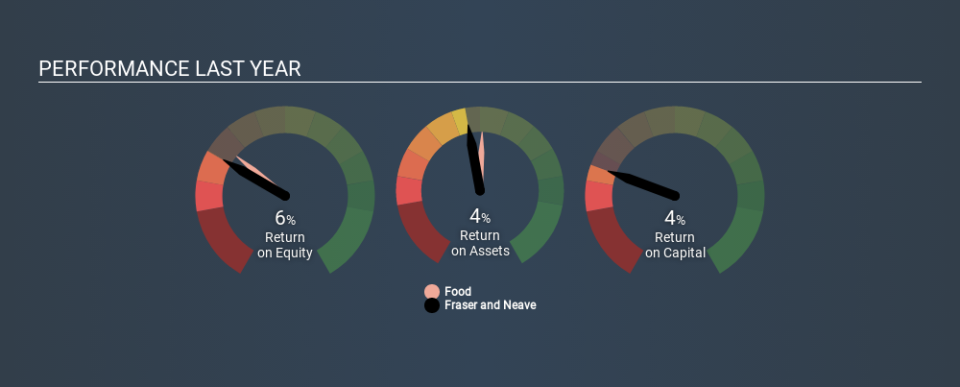
ROCE is commonly used for comparing the performance of similar businesses. In this analysis, Fraser and Neave's ROCE appears meaningfully below the 7.5% average reported by the Food industry. This performance is not ideal, as it suggests the company may not be deploying its capital as effectively as some competitors. Independently of how Fraser and Neave compares to its industry, its ROCE in absolute terms is low; especially compared to the ~1.8% available in government bonds. Readers may wish to look for more rewarding investments.
You can click on the image below to see (in greater detail) how Fraser and Neave's past growth compares to other companies.
Remember that this metric is backwards looking - it shows what has happened in the past, and does not accurately predict the future. ROCE can be misleading for companies in cyclical industries, with returns looking impressive during the boom times, but very weak during the busts. ROCE is only a point-in-time measure. How cyclical is Fraser and Neave? You can see for yourself by looking at this free graph of past earnings, revenue and cash flow.
Do Fraser and Neave's Current Liabilities Skew Its ROCE?
Current liabilities include invoices, such as supplier payments, short-term debt, or a tax bill, that need to be paid within 12 months. The ROCE equation subtracts current liabilities from capital employed, so a company with a lot of current liabilities appears to have less capital employed, and a higher ROCE than otherwise. To counter this, investors can check if a company has high current liabilities relative to total assets.
Fraser and Neave has total assets of S$4.8b and current liabilities of S$521m. Therefore its current liabilities are equivalent to approximately 11% of its total assets. This is a modest level of current liabilities, which will have a limited impact on the ROCE.
The Bottom Line On Fraser and Neave's ROCE
Fraser and Neave has a poor ROCE, and there may be better investment prospects out there. Of course, you might also be able to find a better stock than Fraser and Neave. So you may wish to see this free collection of other companies that have grown earnings strongly.
If you like to buy stocks alongside management, then you might just love this free list of companies. (Hint: insiders have been buying them).
If you spot an error that warrants correction, please contact the editor at editorial-team@simplywallst.com. This article by Simply Wall St is general in nature. It does not constitute a recommendation to buy or sell any stock, and does not take account of your objectives, or your financial situation. Simply Wall St has no position in the stocks mentioned.
We aim to bring you long-term focused research analysis driven by fundamental data. Note that our analysis may not factor in the latest price-sensitive company announcements or qualitative material. Thank you for reading.

