Why Gold Peak Industries (Holdings) Limited’s (HKG:40) Return On Capital Employed Might Be A Concern

Today we'll look at Gold Peak Industries (Holdings) Limited (HKG:40) and reflect on its potential as an investment. In particular, we'll consider its Return On Capital Employed (ROCE), as that can give us insight into how profitably the company is able to employ capital in its business.
First up, we'll look at what ROCE is and how we calculate it. Then we'll compare its ROCE to similar companies. Then we'll determine how its current liabilities are affecting its ROCE.
What is Return On Capital Employed (ROCE)?
ROCE measures the amount of pre-tax profits a company can generate from the capital employed in its business. Generally speaking a higher ROCE is better. In brief, it is a useful tool, but it is not without drawbacks. Renowned investment researcher Michael Mauboussin has suggested that a high ROCE can indicate that 'one dollar invested in the company generates value of more than one dollar'.
So, How Do We Calculate ROCE?
The formula for calculating the return on capital employed is:
Return on Capital Employed = Earnings Before Interest and Tax (EBIT) ÷ (Total Assets - Current Liabilities)
Or for Gold Peak Industries (Holdings):
0.052 = HK$185m ÷ (HK$7.3b - HK$3.7b) (Based on the trailing twelve months to September 2019.)
So, Gold Peak Industries (Holdings) has an ROCE of 5.2%.
See our latest analysis for Gold Peak Industries (Holdings)
Does Gold Peak Industries (Holdings) Have A Good ROCE?
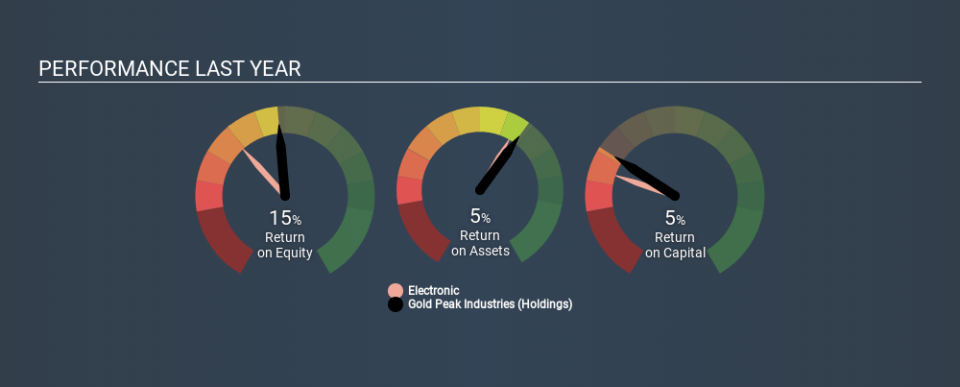
One way to assess ROCE is to compare similar companies. Using our data, Gold Peak Industries (Holdings)'s ROCE appears to be significantly below the 9.8% average in the Electronic industry. This performance could be negative if sustained, as it suggests the business may underperform its industry. Aside from the industry comparison, Gold Peak Industries (Holdings)'s ROCE is mediocre in absolute terms, considering the risk of investing in stocks versus the safety of a bank account. It is possible that there are more rewarding investments out there.
Our data shows that Gold Peak Industries (Holdings) currently has an ROCE of 5.2%, compared to its ROCE of 3.5% 3 years ago. This makes us wonder if the company is improving. You can see in the image below how Gold Peak Industries (Holdings)'s ROCE compares to its industry. Click to see more on past growth.
When considering ROCE, bear in mind that it reflects the past and does not necessarily predict the future. Companies in cyclical industries can be difficult to understand using ROCE, as returns typically look high during boom times, and low during busts. ROCE is, after all, simply a snap shot of a single year. You can check if Gold Peak Industries (Holdings) has cyclical profits by looking at this free graph of past earnings, revenue and cash flow.
Do Gold Peak Industries (Holdings)'s Current Liabilities Skew Its ROCE?
Liabilities, such as supplier bills and bank overdrafts, are referred to as current liabilities if they need to be paid within 12 months. Due to the way the ROCE equation works, having large bills due in the near term can make it look as though a company has less capital employed, and thus a higher ROCE than usual. To check the impact of this, we calculate if a company has high current liabilities relative to its total assets.
Gold Peak Industries (Holdings) has total assets of HK$7.3b and current liabilities of HK$3.7b. As a result, its current liabilities are equal to approximately 51% of its total assets. Gold Peak Industries (Holdings) has a fairly high level of current liabilities, meaningfully impacting its ROCE.
Our Take On Gold Peak Industries (Holdings)'s ROCE
Notably, it also has a mediocre ROCE, which to my mind is not an appealing combination. Of course, you might find a fantastic investment by looking at a few good candidates. So take a peek at this free list of companies with modest (or no) debt, trading on a P/E below 20.
If you like to buy stocks alongside management, then you might just love this free list of companies. (Hint: insiders have been buying them).
If you spot an error that warrants correction, please contact the editor at editorial-team@simplywallst.com. This article by Simply Wall St is general in nature. It does not constitute a recommendation to buy or sell any stock, and does not take account of your objectives, or your financial situation. Simply Wall St has no position in the stocks mentioned.
We aim to bring you long-term focused research analysis driven by fundamental data. Note that our analysis may not factor in the latest price-sensitive company announcements or qualitative material. Thank you for reading.
