Why Green Cross Health Limited’s (NZSE:GXH) Return On Capital Employed Is Impressive

Today we'll look at Green Cross Health Limited (NZSE:GXH) and reflect on its potential as an investment. In particular, we'll consider its Return On Capital Employed (ROCE), as that can give us insight into how profitably the company is able to employ capital in its business.
First of all, we'll work out how to calculate ROCE. Next, we'll compare it to others in its industry. Last but not least, we'll look at what impact its current liabilities have on its ROCE.
Return On Capital Employed (ROCE): What is it?
ROCE is a metric for evaluating how much pre-tax income (in percentage terms) a company earns on the capital invested in its business. Generally speaking a higher ROCE is better. Overall, it is a valuable metric that has its flaws. Author Edwin Whiting says to be careful when comparing the ROCE of different businesses, since 'No two businesses are exactly alike.'
How Do You Calculate Return On Capital Employed?
Analysts use this formula to calculate return on capital employed:
Return on Capital Employed = Earnings Before Interest and Tax (EBIT) ÷ (Total Assets - Current Liabilities)
Or for Green Cross Health:
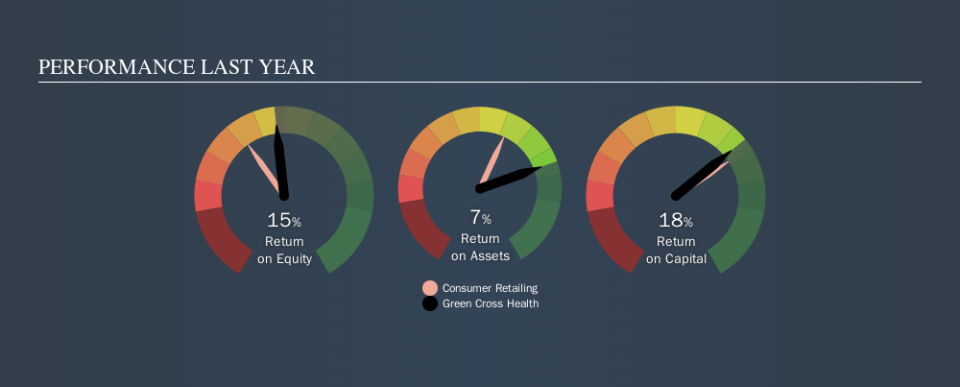
0.18 = NZ$28m ÷ (NZ$265m - NZ$107m) (Based on the trailing twelve months to March 2019.)
So, Green Cross Health has an ROCE of 18%.
Check out our latest analysis for Green Cross Health
Is Green Cross Health's ROCE Good?
ROCE can be useful when making comparisons, such as between similar companies. Green Cross Health's ROCE appears to be substantially greater than the 9.5% average in the Consumer Retailing industry. We would consider this a positive, as it suggests it is using capital more effectively than other similar companies. Separate from Green Cross Health's performance relative to its industry, its ROCE in absolute terms looks satisfactory, and it may be worth researching in more depth.
You can click on the image below to see (in greater detail) how Green Cross Health's past growth compares to other companies.
Remember that this metric is backwards looking - it shows what has happened in the past, and does not accurately predict the future. Companies in cyclical industries can be difficult to understand using ROCE, as returns typically look high during boom times, and low during busts. ROCE is, after all, simply a snap shot of a single year. If Green Cross Health is cyclical, it could make sense to check out this free graph of past earnings, revenue and cash flow.
How Green Cross Health's Current Liabilities Impact Its ROCE
Liabilities, such as supplier bills and bank overdrafts, are referred to as current liabilities if they need to be paid within 12 months. Due to the way the ROCE equation works, having large bills due in the near term can make it look as though a company has less capital employed, and thus a higher ROCE than usual. To counter this, investors can check if a company has high current liabilities relative to total assets.
Green Cross Health has total liabilities of NZ$107m and total assets of NZ$265m. Therefore its current liabilities are equivalent to approximately 41% of its total assets. With this level of current liabilities, Green Cross Health's ROCE is boosted somewhat.
What We Can Learn From Green Cross Health's ROCE
While its ROCE looks good, it's worth remembering that the current liabilities are making the business look better. Green Cross Health shapes up well under this analysis, but it is far from the only business delivering excellent numbers . You might also want to check this free collection of companies delivering excellent earnings growth.
For those who like to find winning investments this free list of growing companies with recent insider purchasing, could be just the ticket.
We aim to bring you long-term focused research analysis driven by fundamental data. Note that our analysis may not factor in the latest price-sensitive company announcements or qualitative material.
If you spot an error that warrants correction, please contact the editor at editorial-team@simplywallst.com. This article by Simply Wall St is general in nature. It does not constitute a recommendation to buy or sell any stock, and does not take account of your objectives, or your financial situation. Simply Wall St has no position in the stocks mentioned. Thank you for reading.
