Here’s why Groupe JAJ’s (EPA:GJAJ) Returns On Capital Matters So Much

Today we'll evaluate Groupe JAJ (EPA:GJAJ) to determine whether it could have potential as an investment idea. To be precise, we'll consider its Return On Capital Employed (ROCE), as that will inform our view of the quality of the business.
First up, we'll look at what ROCE is and how we calculate it. Second, we'll look at its ROCE compared to similar companies. Finally, we'll look at how its current liabilities affect its ROCE.
Return On Capital Employed (ROCE): What is it?
ROCE measures the 'return' (pre-tax profit) a company generates from capital employed in its business. In general, businesses with a higher ROCE are usually better quality. In brief, it is a useful tool, but it is not without drawbacks. Author Edwin Whiting says to be careful when comparing the ROCE of different businesses, since 'No two businesses are exactly alike.
How Do You Calculate Return On Capital Employed?
Analysts use this formula to calculate return on capital employed:
Return on Capital Employed = Earnings Before Interest and Tax (EBIT) ÷ (Total Assets - Current Liabilities)
Or for Groupe JAJ:
0.022 = €103k ÷ (€18m - €14m) (Based on the trailing twelve months to September 2019.)
So, Groupe JAJ has an ROCE of 2.2%.
Check out our latest analysis for Groupe JAJ
Does Groupe JAJ Have A Good ROCE?
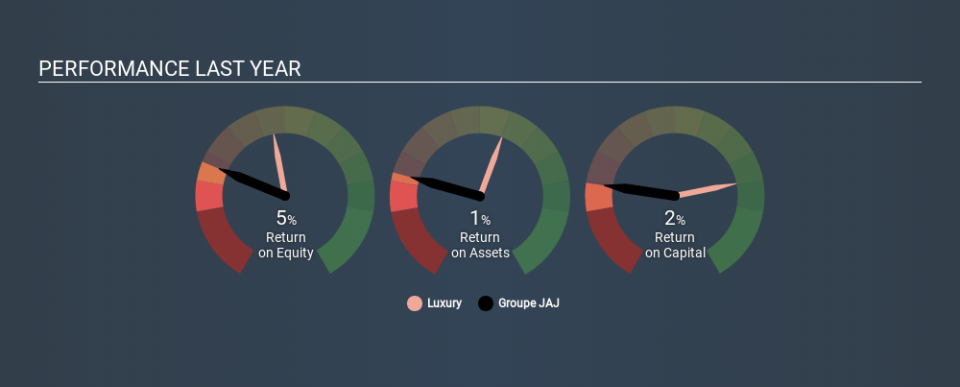
ROCE can be useful when making comparisons, such as between similar companies. Using our data, Groupe JAJ's ROCE appears to be significantly below the 12% average in the Luxury industry. This performance could be negative if sustained, as it suggests the business may underperform its industry. Regardless of how Groupe JAJ stacks up against its industry, its ROCE in absolute terms is quite low (especially compared to a bank account). Readers may wish to look for more rewarding investments.
We can see that, Groupe JAJ currently has an ROCE of 2.2%, less than the 21% it reported 3 years ago. This makes us wonder if the business is facing new challenges. You can see in the image below how Groupe JAJ's ROCE compares to its industry. Click to see more on past growth.
It is important to remember that ROCE shows past performance, and is not necessarily predictive. ROCE can be misleading for companies in cyclical industries, with returns looking impressive during the boom times, but very weak during the busts. ROCE is, after all, simply a snap shot of a single year. How cyclical is Groupe JAJ? You can see for yourself by looking at this free graph of past earnings, revenue and cash flow.
What Are Current Liabilities, And How Do They Affect Groupe JAJ's ROCE?
Short term (or current) liabilities, are things like supplier invoices, overdrafts, or tax bills that need to be paid within 12 months. Due to the way ROCE is calculated, a high level of current liabilities makes a company look as though it has less capital employed, and thus can (sometimes unfairly) boost the ROCE. To counter this, investors can check if a company has high current liabilities relative to total assets.
Groupe JAJ has total assets of €18m and current liabilities of €14m. Therefore its current liabilities are equivalent to approximately 75% of its total assets. This is a fairly high level of current liabilities, boosting Groupe JAJ's ROCE.
Our Take On Groupe JAJ's ROCE
Unfortunately, its ROCE is also pretty low, so we are cautious about the stock. Of course, you might find a fantastic investment by looking at a few good candidates. So take a peek at this free list of companies with modest (or no) debt, trading on a P/E below 20.
I will like Groupe JAJ better if I see some big insider buys. While we wait, check out this free list of growing companies with considerable, recent, insider buying.
If you spot an error that warrants correction, please contact the editor at editorial-team@simplywallst.com. This article by Simply Wall St is general in nature. It does not constitute a recommendation to buy or sell any stock, and does not take account of your objectives, or your financial situation. Simply Wall St has no position in the stocks mentioned.
We aim to bring you long-term focused research analysis driven by fundamental data. Note that our analysis may not factor in the latest price-sensitive company announcements or qualitative material. Thank you for reading.
