Why We Like Healthcare Services Group, Inc.’s (NASDAQ:HCSG) 17% Return On Capital Employed

Today we'll evaluate Healthcare Services Group, Inc. (NASDAQ:HCSG) to determine whether it could have potential as an investment idea. In particular, we'll consider its Return On Capital Employed (ROCE), as that can give us insight into how profitably the company is able to employ capital in its business.
First of all, we'll work out how to calculate ROCE. Second, we'll look at its ROCE compared to similar companies. Then we'll determine how its current liabilities are affecting its ROCE.
Understanding Return On Capital Employed (ROCE)
ROCE measures the 'return' (pre-tax profit) a company generates from capital employed in its business. Generally speaking a higher ROCE is better. Overall, it is a valuable metric that has its flaws. Author Edwin Whiting says to be careful when comparing the ROCE of different businesses, since 'No two businesses are exactly alike.
So, How Do We Calculate ROCE?
Analysts use this formula to calculate return on capital employed:
Return on Capital Employed = Earnings Before Interest and Tax (EBIT) ÷ (Total Assets - Current Liabilities)
Or for Healthcare Services Group:
0.17 = US$95m ÷ (US$726m - US$160m) (Based on the trailing twelve months to September 2019.)
So, Healthcare Services Group has an ROCE of 17%.
View our latest analysis for Healthcare Services Group
Is Healthcare Services Group's ROCE Good?
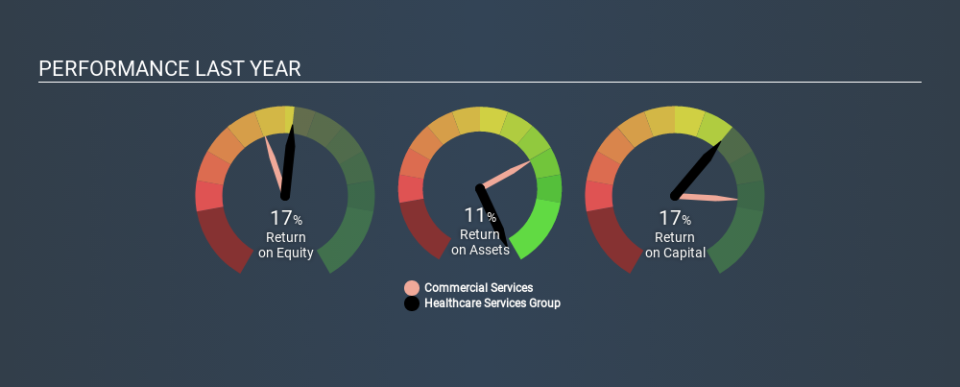
ROCE can be useful when making comparisons, such as between similar companies. In our analysis, Healthcare Services Group's ROCE is meaningfully higher than the 9.4% average in the Commercial Services industry. We consider this a positive sign, because it suggests it uses capital more efficiently than similar companies. Regardless of where Healthcare Services Group sits next to its industry, its ROCE in absolute terms appears satisfactory, and this company could be worth a closer look.
Healthcare Services Group's current ROCE of 17% is lower than its ROCE in the past, which was 23%, 3 years ago. This makes us wonder if the business is facing new challenges. The image below shows how Healthcare Services Group's ROCE compares to its industry, and you can click it to see more detail on its past growth.
When considering ROCE, bear in mind that it reflects the past and does not necessarily predict the future. ROCE can be deceptive for cyclical businesses, as returns can look incredible in boom times, and terribly low in downturns. ROCE is, after all, simply a snap shot of a single year. What happens in the future is pretty important for investors, so we have prepared a free report on analyst forecasts for Healthcare Services Group.
Healthcare Services Group's Current Liabilities And Their Impact On Its ROCE
Current liabilities are short term bills and invoices that need to be paid in 12 months or less. Due to the way the ROCE equation works, having large bills due in the near term can make it look as though a company has less capital employed, and thus a higher ROCE than usual. To counter this, investors can check if a company has high current liabilities relative to total assets.
Healthcare Services Group has total assets of US$726m and current liabilities of US$160m. Therefore its current liabilities are equivalent to approximately 22% of its total assets. A fairly low level of current liabilities is not influencing the ROCE too much.
Our Take On Healthcare Services Group's ROCE
This is good to see, and with a sound ROCE, Healthcare Services Group could be worth a closer look. Healthcare Services Group shapes up well under this analysis, but it is far from the only business delivering excellent numbers . You might also want to check this free collection of companies delivering excellent earnings growth.
For those who like to find winning investments this free list of growing companies with recent insider purchasing, could be just the ticket.
If you spot an error that warrants correction, please contact the editor at editorial-team@simplywallst.com. This article by Simply Wall St is general in nature. It does not constitute a recommendation to buy or sell any stock, and does not take account of your objectives, or your financial situation. Simply Wall St has no position in the stocks mentioned.
We aim to bring you long-term focused research analysis driven by fundamental data. Note that our analysis may not factor in the latest price-sensitive company announcements or qualitative material. Thank you for reading.

