Why The Hong Kong and China Gas Company Limited’s (HKG:3) Return On Capital Employed Looks Uninspiring

Today we'll evaluate The Hong Kong and China Gas Company Limited (HKG:3) to determine whether it could have potential as an investment idea. Specifically, we're going to calculate its Return On Capital Employed (ROCE), in the hopes of getting some insight into the business.
First, we'll go over how we calculate ROCE. Second, we'll look at its ROCE compared to similar companies. Last but not least, we'll look at what impact its current liabilities have on its ROCE.
What is Return On Capital Employed (ROCE)?
ROCE is a metric for evaluating how much pre-tax income (in percentage terms) a company earns on the capital invested in its business. All else being equal, a better business will have a higher ROCE. In brief, it is a useful tool, but it is not without drawbacks. Renowned investment researcher Michael Mauboussin has suggested that a high ROCE can indicate that 'one dollar invested in the company generates value of more than one dollar'.
So, How Do We Calculate ROCE?
Analysts use this formula to calculate return on capital employed:
Return on Capital Employed = Earnings Before Interest and Tax (EBIT) ÷ (Total Assets - Current Liabilities)
Or for Hong Kong and China Gas:
0.073 = HK$8.1b ÷ (HK$135b - HK$25b) (Based on the trailing twelve months to June 2019.)
So, Hong Kong and China Gas has an ROCE of 7.3%.
Check out our latest analysis for Hong Kong and China Gas
Is Hong Kong and China Gas's ROCE Good?
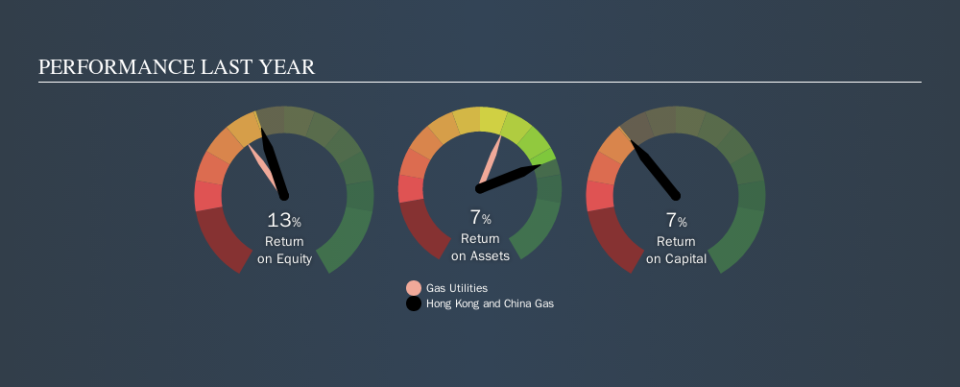
When making comparisons between similar businesses, investors may find ROCE useful. We can see Hong Kong and China Gas's ROCE is meaningfully below the Gas Utilities industry average of 9.3%. This could be seen as a negative, as it suggests some competitors may be employing their capital more efficiently. Separate from how Hong Kong and China Gas stacks up against its industry, its ROCE in absolute terms is mediocre; relative to the returns on government bonds. It is possible that there are more rewarding investments out there.
You can see in the image below how Hong Kong and China Gas's ROCE compares to its industry. Click to see more on past growth.
When considering ROCE, bear in mind that it reflects the past and does not necessarily predict the future. ROCE can be deceptive for cyclical businesses, as returns can look incredible in boom times, and terribly low in downturns. ROCE is, after all, simply a snap shot of a single year. What happens in the future is pretty important for investors, so we have prepared a free report on analyst forecasts for Hong Kong and China Gas.
Hong Kong and China Gas's Current Liabilities And Their Impact On Its ROCE
Liabilities, such as supplier bills and bank overdrafts, are referred to as current liabilities if they need to be paid within 12 months. Due to the way the ROCE equation works, having large bills due in the near term can make it look as though a company has less capital employed, and thus a higher ROCE than usual. To counter this, investors can check if a company has high current liabilities relative to total assets.
Hong Kong and China Gas has total liabilities of HK$25b and total assets of HK$135b. Therefore its current liabilities are equivalent to approximately 18% of its total assets. It is good to see a restrained amount of current liabilities, as this limits the effect on ROCE.
The Bottom Line On Hong Kong and China Gas's ROCE
With that in mind, we're not overly impressed with Hong Kong and China Gas's ROCE, so it may not be the most appealing prospect. Of course, you might also be able to find a better stock than Hong Kong and China Gas. So you may wish to see this free collection of other companies that have grown earnings strongly.
I will like Hong Kong and China Gas better if I see some big insider buys. While we wait, check out this free list of growing companies with considerable, recent, insider buying.
We aim to bring you long-term focused research analysis driven by fundamental data. Note that our analysis may not factor in the latest price-sensitive company announcements or qualitative material.
If you spot an error that warrants correction, please contact the editor at editorial-team@simplywallst.com. This article by Simply Wall St is general in nature. It does not constitute a recommendation to buy or sell any stock, and does not take account of your objectives, or your financial situation. Simply Wall St has no position in the stocks mentioned. Thank you for reading.
