Why IMS Group Holdings Limited (HKG:8136) Looks Like A Quality Company

One of the best investments we can make is in our own knowledge and skill set. With that in mind, this article will work through how we can use Return On Equity (ROE) to better understand a business. By way of learning-by-doing, we'll look at ROE to gain a better understanding of IMS Group Holdings Limited (HKG:8136).
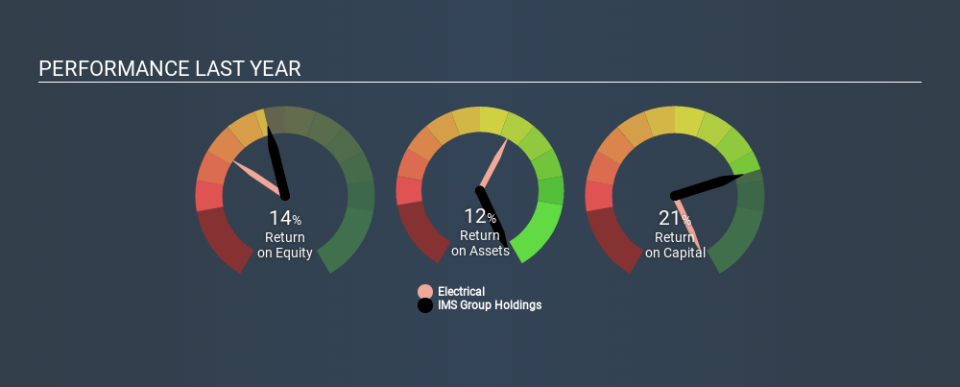
Our data shows IMS Group Holdings has a return on equity of 14% for the last year. Another way to think of that is that for every HK$1 worth of equity in the company, it was able to earn HK$0.14.
View our latest analysis for IMS Group Holdings
How Do I Calculate ROE?
The formula for ROE is:
Return on Equity = Net Profit (from continuing operations) ÷ Shareholders' Equity
Or for IMS Group Holdings:
14% = HK$9.7m ÷ HK$71m (Based on the trailing twelve months to December 2019.)
Most readers would understand what net profit is, but it’s worth explaining the concept of shareholders’ equity. It is all earnings retained by the company, plus any capital paid in by shareholders. You can calculate shareholders' equity by subtracting the company's total liabilities from its total assets.
What Does ROE Mean?
ROE looks at the amount a company earns relative to the money it has kept within the business. The 'return' is the amount earned after tax over the last twelve months. The higher the ROE, the more profit the company is making. So, all else equal, investors should like a high ROE. That means it can be interesting to compare the ROE of different companies.
Does IMS Group Holdings Have A Good ROE?
One simple way to determine if a company has a good return on equity is to compare it to the average for its industry. However, this method is only useful as a rough check, because companies do differ quite a bit within the same industry classification. Pleasingly, IMS Group Holdings has a superior ROE than the average (7.1%) company in the Electrical industry.
That is a good sign. In my book, a high ROE almost always warrants a closer look. For example you might check if insiders are buying shares.
How Does Debt Impact Return On Equity?
Most companies need money -- from somewhere -- to grow their profits. That cash can come from issuing shares, retained earnings, or debt. In the case of the first and second options, the ROE will reflect this use of cash, for growth. In the latter case, the debt used for growth will improve returns, but won't affect the total equity. That will make the ROE look better than if no debt was used.
Combining IMS Group Holdings's Debt And Its 14% Return On Equity
IMS Group Holdings is free of net debt, which is a positive for shareholders. Its ROE already suggests it is a good business, but the fact it has achieved this -- and doesn't borrowings -- makes it worthy of further consideration, in my view. After all, with cash on the balance sheet, a company has a lot more optionality in good times and bad.
But It's Just One Metric
Return on equity is a useful indicator of the ability of a business to generate profits and return them to shareholders. In my book the highest quality companies have high return on equity, despite low debt. If two companies have the same ROE, then I would generally prefer the one with less debt.
Having said that, while ROE is a useful indicator of business quality, you'll have to look at a whole range of factors to determine the right price to buy a stock. Profit growth rates, versus the expectations reflected in the price of the stock, are a particularly important to consider. You can see how the company has grow in the past by looking at this FREE detailed graph of past earnings, revenue and cash flow.
Of course, you might find a fantastic investment by looking elsewhere. So take a peek at this free list of interesting companies.
If you spot an error that warrants correction, please contact the editor at editorial-team@simplywallst.com. This article by Simply Wall St is general in nature. It does not constitute a recommendation to buy or sell any stock, and does not take account of your objectives, or your financial situation. Simply Wall St has no position in the stocks mentioned.
We aim to bring you long-term focused research analysis driven by fundamental data. Note that our analysis may not factor in the latest price-sensitive company announcements or qualitative material. Thank you for reading.
