Why IPE Group Limited’s (HKG:929) Return On Capital Employed Looks Uninspiring

Want to participate in a short research study? Help shape the future of investing tools and you could win a $250 gift card!
Today we'll look at IPE Group Limited (HKG:929) and reflect on its potential as an investment. Specifically, we're going to calculate its Return On Capital Employed (ROCE), in the hopes of getting some insight into the business.
First, we'll go over how we calculate ROCE. Second, we'll look at its ROCE compared to similar companies. Then we'll determine how its current liabilities are affecting its ROCE.
Understanding Return On Capital Employed (ROCE)
ROCE measures the 'return' (pre-tax profit) a company generates from capital employed in its business. In general, businesses with a higher ROCE are usually better quality. In brief, it is a useful tool, but it is not without drawbacks. Renowned investment researcher Michael Mauboussin has suggested that a high ROCE can indicate that 'one dollar invested in the company generates value of more than one dollar'.
How Do You Calculate Return On Capital Employed?
Analysts use this formula to calculate return on capital employed:
Return on Capital Employed = Earnings Before Interest and Tax (EBIT) ÷ (Total Assets - Current Liabilities)
Or for IPE Group:
0.066 = HK$113m ÷ (HK$2.3b - HK$551m) (Based on the trailing twelve months to December 2018.)
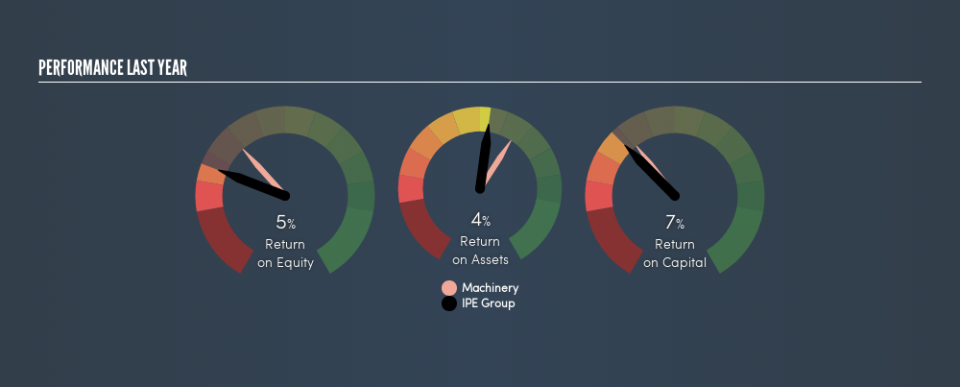
So, IPE Group has an ROCE of 6.6%.
View our latest analysis for IPE Group
Does IPE Group Have A Good ROCE?
ROCE is commonly used for comparing the performance of similar businesses. We can see IPE Group's ROCE is meaningfully below the Machinery industry average of 10%. This performance is not ideal, as it suggests the company may not be deploying its capital as effectively as some competitors. Aside from the industry comparison, IPE Group's ROCE is mediocre in absolute terms, considering the risk of investing in stocks versus the safety of a bank account. Investors may wish to consider higher-performing investments.
When considering ROCE, bear in mind that it reflects the past and does not necessarily predict the future. Companies in cyclical industries can be difficult to understand using ROCE, as returns typically look high during boom times, and low during busts. ROCE is only a point-in-time measure. You can check if IPE Group has cyclical profits by looking at this free graph of past earnings, revenue and cash flow.
What Are Current Liabilities, And How Do They Affect IPE Group's ROCE?
Short term (or current) liabilities, are things like supplier invoices, overdrafts, or tax bills that need to be paid within 12 months. The ROCE equation subtracts current liabilities from capital employed, so a company with a lot of current liabilities appears to have less capital employed, and a higher ROCE than otherwise. To check the impact of this, we calculate if a company has high current liabilities relative to its total assets.
IPE Group has total assets of HK$2.3b and current liabilities of HK$551m. Therefore its current liabilities are equivalent to approximately 24% of its total assets. This very reasonable level of current liabilities would not boost the ROCE by much.
Our Take On IPE Group's ROCE
If IPE Group continues to earn an uninspiring ROCE, there may be better places to invest. Of course, you might also be able to find a better stock than IPE Group. So you may wish to see this free collection of other companies that have grown earnings strongly.
I will like IPE Group better if I see some big insider buys. While we wait, check out this free list of growing companies with considerable, recent, insider buying.
We aim to bring you long-term focused research analysis driven by fundamental data. Note that our analysis may not factor in the latest price-sensitive company announcements or qualitative material.
If you spot an error that warrants correction, please contact the editor at editorial-team@simplywallst.com. This article by Simply Wall St is general in nature. It does not constitute a recommendation to buy or sell any stock, and does not take account of your objectives, or your financial situation. Simply Wall St has no position in the stocks mentioned. Thank you for reading.

