Why Jindal Saw Limited’s (NSE:JINDALSAW) Use Of Investor Capital Doesn’t Look Great

Want to participate in a short research study? Help shape the future of investing tools and you could win a $250 gift card!
Today we'll evaluate Jindal Saw Limited (NSE:JINDALSAW) to determine whether it could have potential as an investment idea. Specifically, we'll consider its Return On Capital Employed (ROCE), since that will give us an insight into how efficiently the business can generate profits from the capital it requires.
First of all, we'll work out how to calculate ROCE. Then we'll compare its ROCE to similar companies. Finally, we'll look at how its current liabilities affect its ROCE.
Return On Capital Employed (ROCE): What is it?
ROCE is a measure of a company's yearly pre-tax profit (its return), relative to the capital employed in the business. In general, businesses with a higher ROCE are usually better quality. Ultimately, it is a useful but imperfect metric. Author Edwin Whiting says to be careful when comparing the ROCE of different businesses, since 'No two businesses are exactly alike.'
How Do You Calculate Return On Capital Employed?
Analysts use this formula to calculate return on capital employed:
Return on Capital Employed = Earnings Before Interest and Tax (EBIT) ÷ (Total Assets - Current Liabilities)
Or for Jindal Saw:
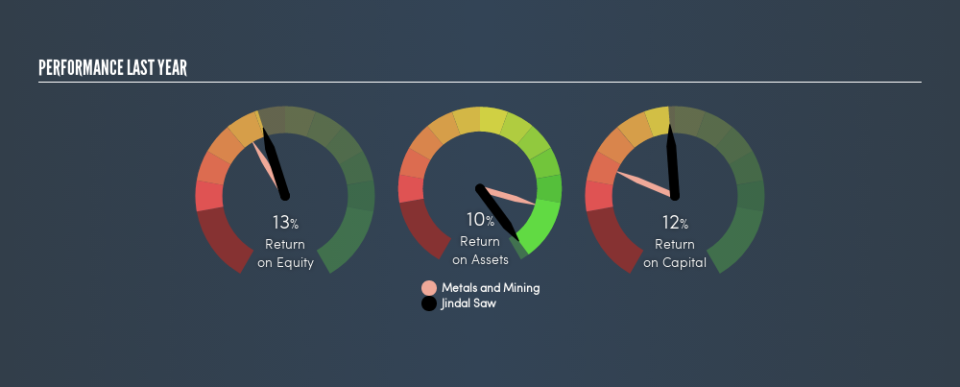
0.12 = ₹11b ÷ (₹152b - ₹58b) (Based on the trailing twelve months to March 2019.)
So, Jindal Saw has an ROCE of 12%.
View our latest analysis for Jindal Saw
Is Jindal Saw's ROCE Good?
When making comparisons between similar businesses, investors may find ROCE useful. Using our data, Jindal Saw's ROCE appears to be significantly below the 14% average in the Metals and Mining industry. This could be seen as a negative, as it suggests some competitors may be employing their capital more efficiently. Separate from how Jindal Saw stacks up against its industry, its ROCE in absolute terms is mediocre; relative to the returns on government bonds. Readers may find more attractive investment prospects elsewhere.
Our data shows that Jindal Saw currently has an ROCE of 12%, compared to its ROCE of 3.9% 3 years ago. This makes us think the business might be improving.
When considering ROCE, bear in mind that it reflects the past and does not necessarily predict the future. ROCE can be deceptive for cyclical businesses, as returns can look incredible in boom times, and terribly low in downturns. This is because ROCE only looks at one year, instead of considering returns across a whole cycle. Given the industry it operates in, Jindal Saw could be considered cyclical. Since the future is so important for investors, you should check out our free report on analyst forecasts for Jindal Saw.
How Jindal Saw's Current Liabilities Impact Its ROCE
Liabilities, such as supplier bills and bank overdrafts, are referred to as current liabilities if they need to be paid within 12 months. The ROCE equation subtracts current liabilities from capital employed, so a company with a lot of current liabilities appears to have less capital employed, and a higher ROCE than otherwise. To counter this, investors can check if a company has high current liabilities relative to total assets.
Jindal Saw has total liabilities of ₹58b and total assets of ₹152b. As a result, its current liabilities are equal to approximately 38% of its total assets. Jindal Saw's ROCE is improved somewhat by its moderate amount of current liabilities.
Our Take On Jindal Saw's ROCE
Unfortunately, its ROCE is still uninspiring, and there are potentially more attractive prospects out there. Of course, you might also be able to find a better stock than Jindal Saw. So you may wish to see this free collection of other companies that have grown earnings strongly.
If you are like me, then you will not want to miss this free list of growing companies that insiders are buying.
We aim to bring you long-term focused research analysis driven by fundamental data. Note that our analysis may not factor in the latest price-sensitive company announcements or qualitative material.
If you spot an error that warrants correction, please contact the editor at editorial-team@simplywallst.com. This article by Simply Wall St is general in nature. It does not constitute a recommendation to buy or sell any stock, and does not take account of your objectives, or your financial situation. Simply Wall St has no position in the stocks mentioned. Thank you for reading.

