Why Justin Allen Holdings Limited’s (HKG:1425) Return On Capital Employed Is Impressive

Today we'll evaluate Justin Allen Holdings Limited (HKG:1425) to determine whether it could have potential as an investment idea. To be precise, we'll consider its Return On Capital Employed (ROCE), as that will inform our view of the quality of the business.
First, we'll go over how we calculate ROCE. Next, we'll compare it to others in its industry. Then we'll determine how its current liabilities are affecting its ROCE.
Understanding Return On Capital Employed (ROCE)
ROCE is a measure of a company's yearly pre-tax profit (its return), relative to the capital employed in the business. In general, businesses with a higher ROCE are usually better quality. Ultimately, it is a useful but imperfect metric. Renowned investment researcher Michael Mauboussin has suggested that a high ROCE can indicate that 'one dollar invested in the company generates value of more than one dollar'.
How Do You Calculate Return On Capital Employed?
Analysts use this formula to calculate return on capital employed:
Return on Capital Employed = Earnings Before Interest and Tax (EBIT) ÷ (Total Assets - Current Liabilities)
Or for Justin Allen Holdings:
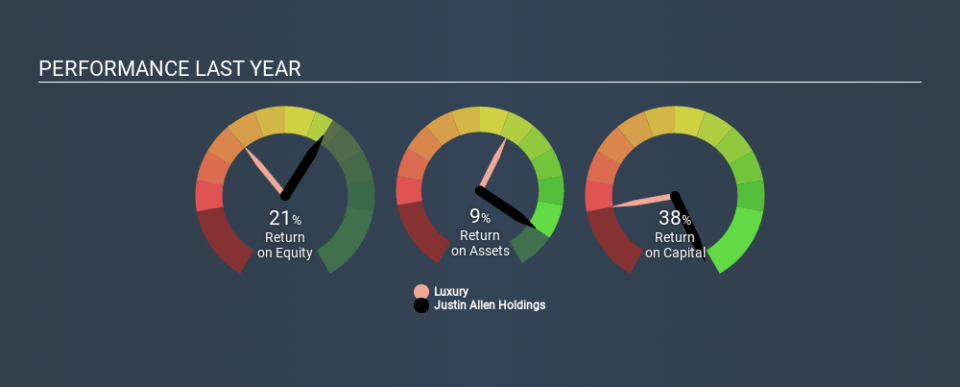
0.38 = HK$77m ÷ (HK$478m - HK$276m) (Based on the trailing twelve months to December 2018.)
Therefore, Justin Allen Holdings has an ROCE of 38%.
Check out our latest analysis for Justin Allen Holdings
Does Justin Allen Holdings Have A Good ROCE?
When making comparisons between similar businesses, investors may find ROCE useful. In our analysis, Justin Allen Holdings's ROCE is meaningfully higher than the 9.6% average in the Luxury industry. I think that's good to see, since it implies the company is better than other companies at making the most of its capital. Regardless of the industry comparison, in absolute terms, Justin Allen Holdings's ROCE currently appears to be excellent.
You can see in the image below how Justin Allen Holdings's ROCE compares to its industry. Click to see more on past growth.
When considering this metric, keep in mind that it is backwards looking, and not necessarily predictive. ROCE can be deceptive for cyclical businesses, as returns can look incredible in boom times, and terribly low in downturns. ROCE is, after all, simply a snap shot of a single year. If Justin Allen Holdings is cyclical, it could make sense to check out this free graph of past earnings, revenue and cash flow.
Justin Allen Holdings's Current Liabilities And Their Impact On Its ROCE
Short term (or current) liabilities, are things like supplier invoices, overdrafts, or tax bills that need to be paid within 12 months. The ROCE equation subtracts current liabilities from capital employed, so a company with a lot of current liabilities appears to have less capital employed, and a higher ROCE than otherwise. To check the impact of this, we calculate if a company has high current liabilities relative to its total assets.
Justin Allen Holdings has current liabilities of HK$276m and total assets of HK$478m. Therefore its current liabilities are equivalent to approximately 58% of its total assets. Justin Allen Holdings's high level of current liabilities boost the ROCE - but its ROCE is still impressive.
Our Take On Justin Allen Holdings's ROCE
So we would be interested in doing more research here -- there may be an opportunity! Justin Allen Holdings shapes up well under this analysis, but it is far from the only business delivering excellent numbers . You might also want to check this free collection of companies delivering excellent earnings growth.
If you are like me, then you will not want to miss this free list of growing companies that insiders are buying.
If you spot an error that warrants correction, please contact the editor at editorial-team@simplywallst.com. This article by Simply Wall St is general in nature. It does not constitute a recommendation to buy or sell any stock, and does not take account of your objectives, or your financial situation. Simply Wall St has no position in the stocks mentioned.
We aim to bring you long-term focused research analysis driven by fundamental data. Note that our analysis may not factor in the latest price-sensitive company announcements or qualitative material. Thank you for reading.

