Why You Should Like Kamdhenu Limited’s (NSE:KAMDHENU) ROCE

Want to participate in a short research study? Help shape the future of investing tools and you could win a $250 gift card!
Today we'll evaluate Kamdhenu Limited (NSE:KAMDHENU) to determine whether it could have potential as an investment idea. To be precise, we'll consider its Return On Capital Employed (ROCE), as that will inform our view of the quality of the business.
First, we'll go over how we calculate ROCE. Next, we'll compare it to others in its industry. And finally, we'll look at how its current liabilities are impacting its ROCE.
Understanding Return On Capital Employed (ROCE)
ROCE measures the amount of pre-tax profits a company can generate from the capital employed in its business. All else being equal, a better business will have a higher ROCE. Ultimately, it is a useful but imperfect metric. Author Edwin Whiting says to be careful when comparing the ROCE of different businesses, since 'No two businesses are exactly alike.'
How Do You Calculate Return On Capital Employed?
Analysts use this formula to calculate return on capital employed:
Return on Capital Employed = Earnings Before Interest and Tax (EBIT) ÷ (Total Assets - Current Liabilities)
Or for Kamdhenu:
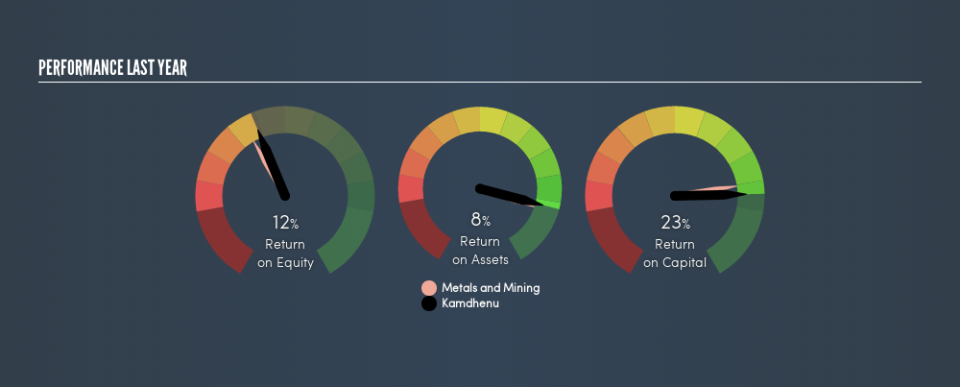
0.23 = ₹461m ÷ (₹4.2b - ₹2.1b) (Based on the trailing twelve months to March 2019.)
Therefore, Kamdhenu has an ROCE of 23%.
See our latest analysis for Kamdhenu
Is Kamdhenu's ROCE Good?
One way to assess ROCE is to compare similar companies. In our analysis, Kamdhenu's ROCE is meaningfully higher than the 15% average in the Metals and Mining industry. We consider this a positive sign, because it suggests it uses capital more efficiently than similar companies. Independently of how Kamdhenu compares to its industry, its ROCE in absolute terms appears decent, and the company may be worthy of closer investigation.
The image below shows how Kamdhenu's ROCE compares to its industry, and you can click it to see more detail on its past growth.
When considering this metric, keep in mind that it is backwards looking, and not necessarily predictive. Companies in cyclical industries can be difficult to understand using ROCE, as returns typically look high during boom times, and low during busts. ROCE is only a point-in-time measure. Remember that most companies like Kamdhenu are cyclical businesses. You can check if Kamdhenu has cyclical profits by looking at this free graph of past earnings, revenue and cash flow.
What Are Current Liabilities, And How Do They Affect Kamdhenu's ROCE?
Current liabilities include invoices, such as supplier payments, short-term debt, or a tax bill, that need to be paid within 12 months. Due to the way ROCE is calculated, a high level of current liabilities makes a company look as though it has less capital employed, and thus can (sometimes unfairly) boost the ROCE. To counter this, investors can check if a company has high current liabilities relative to total assets.
Kamdhenu has total liabilities of ₹2.1b and total assets of ₹4.2b. Therefore its current liabilities are equivalent to approximately 51% of its total assets. Kamdhenu's current liabilities are fairly high, which increases its ROCE significantly.
What We Can Learn From Kamdhenu's ROCE
This ROCE is pretty good, but remember that it would look less impressive with fewer current liabilities. There might be better investments than Kamdhenu out there, but you will have to work hard to find them . These promising businesses with rapidly growing earnings might be right up your alley.
If you like to buy stocks alongside management, then you might just love this free list of companies. (Hint: insiders have been buying them).
We aim to bring you long-term focused research analysis driven by fundamental data. Note that our analysis may not factor in the latest price-sensitive company announcements or qualitative material.
If you spot an error that warrants correction, please contact the editor at editorial-team@simplywallst.com. This article by Simply Wall St is general in nature. It does not constitute a recommendation to buy or sell any stock, and does not take account of your objectives, or your financial situation. Simply Wall St has no position in the stocks mentioned. Thank you for reading.
