Why Kenmare Resources plc’s (LON:KMR) Use Of Investor Capital Doesn’t Look Great

Want to participate in a short research study? Help shape the future of investing tools and you could win a $250 gift card!
Today we’ll look at Kenmare Resources plc (LON:KMR) and reflect on its potential as an investment. To be precise, we’ll consider its Return On Capital Employed (ROCE), as that will inform our view of the quality of the business.
First, we’ll go over how we calculate ROCE. Next, we’ll compare it to others in its industry. Last but not least, we’ll look at what impact its current liabilities have on its ROCE.
Understanding Return On Capital Employed (ROCE)
ROCE measures the ‘return’ (pre-tax profit) a company generates from capital employed in its business. Generally speaking a higher ROCE is better. Overall, it is a valuable metric that has its flaws. Renowned investment researcher Michael Mauboussin has suggested that a high ROCE can indicate that ‘one dollar invested in the company generates value of more than one dollar’.
How Do You Calculate Return On Capital Employed?
The formula for calculating the return on capital employed is:
Return on Capital Employed = Earnings Before Interest and Tax (EBIT) ÷ (Total Assets – Current Liabilities)
Or for Kenmare Resources:
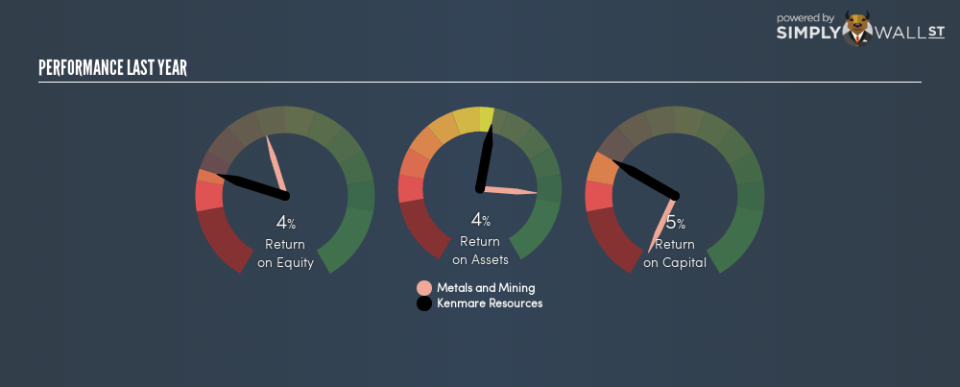
0.048 = US$31m ÷ (US$959m – US$47m) (Based on the trailing twelve months to June 2018.)
Therefore, Kenmare Resources has an ROCE of 4.8%.
See our latest analysis for Kenmare Resources
Is Kenmare Resources’s ROCE Good?
One way to assess ROCE is to compare similar companies. Using our data, Kenmare Resources’s ROCE appears to be significantly below the 13% average in the Metals and Mining industry. This performance could be negative if sustained, as it suggests the business may underperform its industry. Aside from the industry comparison, Kenmare Resources’s ROCE is mediocre in absolute terms, considering the risk of investing in stocks versus the safety of a bank account. Readers may find more attractive investment prospects elsewhere.
Kenmare Resources delivered an ROCE of 4.8%, which is better than 3 years ago, as was making losses back then. This makes us wonder if the company is improving.
It is important to remember that ROCE shows past performance, and is not necessarily predictive. ROCE can be deceptive for cyclical businesses, as returns can look incredible in boom times, and terribly low in downturns. ROCE is only a point-in-time measure. Remember that most companies like Kenmare Resources are cyclical businesses. Since the future is so important for investors, you should check out our free report on analyst forecasts for Kenmare Resources.
What Are Current Liabilities, And How Do They Affect Kenmare Resources’s ROCE?
Short term (or current) liabilities, are things like supplier invoices, overdrafts, or tax bills that need to be paid within 12 months. The ROCE equation subtracts current liabilities from capital employed, so a company with a lot of current liabilities appears to have less capital employed, and a higher ROCE than otherwise. To counter this, investors can check if a company has high current liabilities relative to total assets.
Kenmare Resources has total liabilities of US$47m and total assets of US$959m. As a result, its current liabilities are equal to approximately 4.9% of its total assets. Kenmare Resources reports few current liabilities, which have a negligible impact on its unremarkable ROCE.
What We Can Learn From Kenmare Resources’s ROCE
Based on this information, Kenmare Resources appears to be a mediocre business. But note: Kenmare Resources may not be the best stock to buy. So take a peek at this free list of interesting companies with strong recent earnings growth (and a P/E ratio below 20).
For those who like to find winning investments this free list of growing companies with recent insider purchasing, could be just the ticket.
To help readers see past the short term volatility of the financial market, we aim to bring you a long-term focused research analysis purely driven by fundamental data. Note that our analysis does not factor in the latest price-sensitive company announcements.
The author is an independent contributor and at the time of publication had no position in the stocks mentioned. For errors that warrant correction please contact the editor at editorial-team@simplywallst.com.
