Why Luxey International (Holdings) Limited’s (HKG:8041) Return On Capital Employed Looks Uninspiring

Today we'll evaluate Luxey International (Holdings) Limited (HKG:8041) to determine whether it could have potential as an investment idea. Specifically, we're going to calculate its Return On Capital Employed (ROCE), in the hopes of getting some insight into the business.
First, we'll go over how we calculate ROCE. Next, we'll compare it to others in its industry. Finally, we'll look at how its current liabilities affect its ROCE.
What is Return On Capital Employed (ROCE)?
ROCE measures the 'return' (pre-tax profit) a company generates from capital employed in its business. In general, businesses with a higher ROCE are usually better quality. Ultimately, it is a useful but imperfect metric. Author Edwin Whiting says to be careful when comparing the ROCE of different businesses, since 'No two businesses are exactly alike.
So, How Do We Calculate ROCE?
Analysts use this formula to calculate return on capital employed:
Return on Capital Employed = Earnings Before Interest and Tax (EBIT) ÷ (Total Assets - Current Liabilities)
Or for Luxey International (Holdings):
0.03 = HK$2.6m ÷ (HK$110m - HK$24m) (Based on the trailing twelve months to September 2019.)
Therefore, Luxey International (Holdings) has an ROCE of 3.0%.
See our latest analysis for Luxey International (Holdings)
Is Luxey International (Holdings)'s ROCE Good?
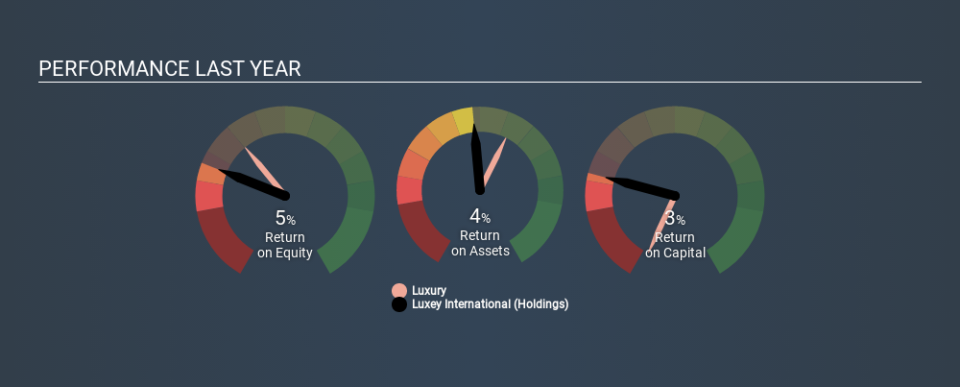
ROCE is commonly used for comparing the performance of similar businesses. We can see Luxey International (Holdings)'s ROCE is meaningfully below the Luxury industry average of 9.6%. This performance is not ideal, as it suggests the company may not be deploying its capital as effectively as some competitors. Independently of how Luxey International (Holdings) compares to its industry, its ROCE in absolute terms is low; especially compared to the ~1.6% available in government bonds. Readers may wish to look for more rewarding investments.
Luxey International (Holdings) delivered an ROCE of 3.0%, which is better than 3 years ago, as was making losses back then. That suggests the business has returned to profitability. You can see in the image below how Luxey International (Holdings)'s ROCE compares to its industry. Click to see more on past growth.
It is important to remember that ROCE shows past performance, and is not necessarily predictive. ROCE can be deceptive for cyclical businesses, as returns can look incredible in boom times, and terribly low in downturns. ROCE is only a point-in-time measure. How cyclical is Luxey International (Holdings)? You can see for yourself by looking at this free graph of past earnings, revenue and cash flow.
What Are Current Liabilities, And How Do They Affect Luxey International (Holdings)'s ROCE?
Current liabilities include invoices, such as supplier payments, short-term debt, or a tax bill, that need to be paid within 12 months. The ROCE equation subtracts current liabilities from capital employed, so a company with a lot of current liabilities appears to have less capital employed, and a higher ROCE than otherwise. To counter this, investors can check if a company has high current liabilities relative to total assets.
Luxey International (Holdings) has total liabilities of HK$24m and total assets of HK$110m. Therefore its current liabilities are equivalent to approximately 22% of its total assets. With a very reasonable level of current liabilities, so the impact on ROCE is fairly minimal.
The Bottom Line On Luxey International (Holdings)'s ROCE
Luxey International (Holdings) has a poor ROCE, and there may be better investment prospects out there. Of course, you might also be able to find a better stock than Luxey International (Holdings). So you may wish to see this free collection of other companies that have grown earnings strongly.
If you are like me, then you will not want to miss this free list of growing companies that insiders are buying.
If you spot an error that warrants correction, please contact the editor at editorial-team@simplywallst.com. This article by Simply Wall St is general in nature. It does not constitute a recommendation to buy or sell any stock, and does not take account of your objectives, or your financial situation. Simply Wall St has no position in the stocks mentioned.
We aim to bring you long-term focused research analysis driven by fundamental data. Note that our analysis may not factor in the latest price-sensitive company announcements or qualitative material. Thank you for reading.
