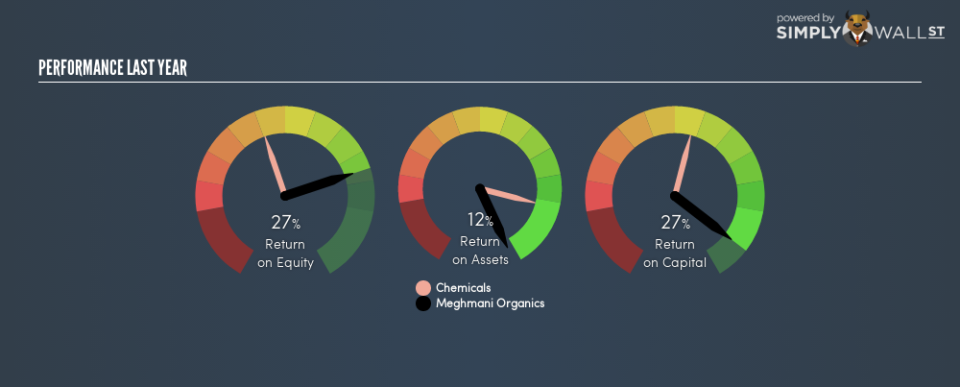
Why We Like Meghmani Organics Limited’s (NSE:MEGH) 27% Return On Capital Employed

Today we’ll evaluate Meghmani Organics Limited (NSE:MEGH) to determine whether it could have potential as an investment idea. In particular, we’ll consider its Return On Capital Employed (ROCE), as that can give us insight into how profitably the company is able to employ capital in its business.
First of all, we’ll work out how to calculate ROCE. Second, we’ll look at its ROCE compared to similar companies. Finally, we’ll look at how its current liabilities affect its ROCE.
Understanding Return On Capital Employed (ROCE)
ROCE measures the amount of pre-tax profits a company can generate from the capital employed in its business. All else being equal, a better business will have a higher ROCE. Overall, it is a valuable metric that has its flaws. Author Edwin Whiting says to be careful when comparing the ROCE of different businesses, since ‘No two businesses are exactly alike.’
How Do You Calculate Return On Capital Employed?
The formula for calculating the return on capital employed is:
Return on Capital Employed = Earnings Before Interest and Tax (EBIT) ÷ (Total Assets – Current Liabilities)
Or for Meghmani Organics:
0.27 = ₹3.4b ÷ (₹21b – ₹6.8b) (Based on the trailing twelve months to September 2018.)
So, Meghmani Organics has an ROCE of 27%.
See our latest analysis for Meghmani Organics
Want to help shape the future of investing tools and platforms? Take the survey and be part of one of the most advanced studies of stock market investors to date.
Does Meghmani Organics Have A Good ROCE?
ROCE is commonly used for comparing the performance of similar businesses. Using our data, we find that Meghmani Organics’s ROCE is meaningfully better than the 17% average in the Chemicals industry. We would consider this a positive, as it suggests it is using capital more effectively than other similar companies. Regardless of the industry comparison, in absolute terms, Meghmani Organics’s ROCE currently appears to be excellent.
In our analysis, Meghmani Organics’s ROCE appears to be 27%, compared to 3 years ago, when its ROCE was 14%. This makes us think about whether the company has been reinvesting shrewdly.
It is important to remember that ROCE shows past performance, and is not necessarily predictive. Companies in cyclical industries can be difficult to understand using ROCE, as returns typically look high during boom times, and low during busts. This is because ROCE only looks at one year, instead of considering returns across a whole cycle. Future performance is what matters, and you can see analyst predictions in our free report on analyst forecasts for the company.
Do Meghmani Organics’s Current Liabilities Skew Its ROCE?
Liabilities, such as supplier bills and bank overdrafts, are referred to as current liabilities if they need to be paid within 12 months. Due to the way the ROCE equation works, having large bills due in the near term can make it look as though a company has less capital employed, and thus a higher ROCE than usual. To counter this, investors can check if a company has high current liabilities relative to total assets.
Meghmani Organics has total assets of ₹21b and current liabilities of ₹6.8b. As a result, its current liabilities are equal to approximately 33% of its total assets. Meghmani Organics’s ROCE is boosted somewhat by its middling amount of current liabilities.
What We Can Learn From Meghmani Organics’s ROCE
Still, it has a high ROCE, and may be an interesting prospect for further research. But note: Meghmani Organics may not be the best stock to buy. So take a peek at this free list of interesting companies with strong recent earnings growth (and a P/E ratio below 20).
If you like to buy stocks alongside management, then you might just love this free list of companies. (Hint: insiders have been buying them).
To help readers see past the short term volatility of the financial market, we aim to bring you a long-term focused research analysis purely driven by fundamental data. Note that our analysis does not factor in the latest price-sensitive company announcements.
The author is an independent contributor and at the time of publication had no position in the stocks mentioned. For errors that warrant correction please contact the editor at editorial-team@simplywallst.com.

