Why Milestone Builder Holdings Limited’s (HKG:1667) High P/E Ratio Isn’t Necessarily A Bad Thing

This article is written for those who want to get better at using price to earnings ratios (P/E ratios). To keep it practical, we’ll show how Milestone Builder Holdings Limited’s (HKG:1667) P/E ratio could help you assess the value on offer. Based on the last twelve months, Milestone Builder Holdings’s P/E ratio is 15.14. In other words, at today’s prices, investors are paying HK$15.14 for every HK$1 in prior year profit.
Check out our latest analysis for Milestone Builder Holdings
Want to help shape the future of investing tools and platforms? Take the survey and be part of one of the most advanced studies of stock market investors to date.
How Do You Calculate A P/E Ratio?
The formula for price to earnings is:
Price to Earnings Ratio = Share Price ÷ Earnings per Share (EPS)
Or for Milestone Builder Holdings:
P/E of 15.14 = HK$0.24 ÷ HK$0.016 (Based on the year to September 2018.)
Is A High P/E Ratio Good?
A higher P/E ratio means that investors are paying a higher price for each HK$1 of company earnings. That isn’t a good or a bad thing on its own, but a high P/E means that buyers have a higher opinion of the business’s prospects, relative to stocks with a lower P/E.
How Growth Rates Impact P/E Ratios
P/E ratios primarily reflect market expectations around earnings growth rates. Earnings growth means that in the future the ‘E’ will be higher. That means unless the share price increases, the P/E will reduce in a few years. So while a stock may look expensive based on past earnings, it could be cheap based on future earnings.
It’s great to see that Milestone Builder Holdings grew EPS by 23% in the last year.
How Does Milestone Builder Holdings’s P/E Ratio Compare To Its Peers?
We can get an indication of market expectations by looking at the P/E ratio. You can see in the image below that the average P/E (10.4) for companies in the construction industry is lower than Milestone Builder Holdings’s P/E.
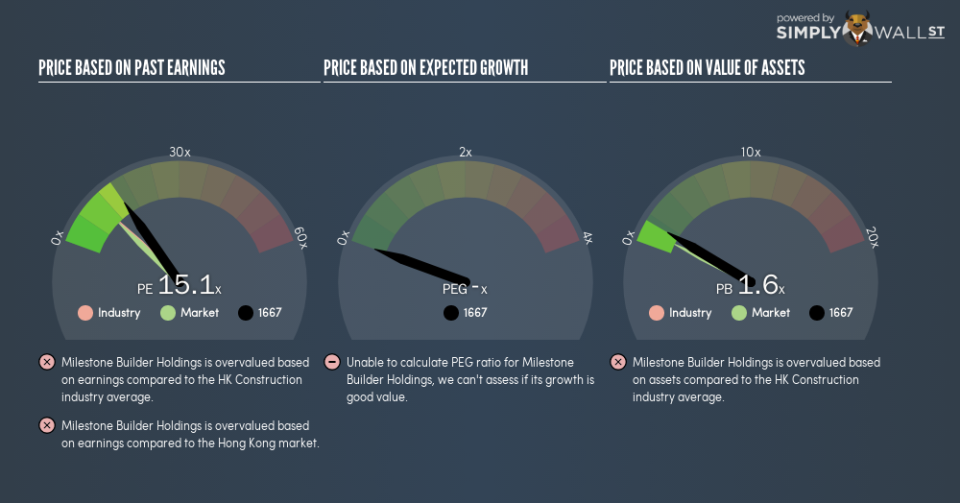
That means that the market expects Milestone Builder Holdings will outperform other companies in its industry. Clearly the market expects growth, but it isn’t guaranteed. So further research is always essential. I often monitor director buying and selling.
Remember: P/E Ratios Don’t Consider The Balance Sheet
Don’t forget that the P/E ratio considers market capitalization. That means it doesn’t take debt or cash into account. Theoretically, a business can improve its earnings (and produce a lower P/E in the future), by taking on debt (or spending its remaining cash).
Such expenditure might be good or bad, in the long term, but the point here is that the balance sheet is not reflected by this ratio.
Milestone Builder Holdings’s Balance Sheet
Net debt totals 55% of Milestone Builder Holdings’s market cap. If you want to compare its P/E ratio to other companies, you should absolutely keep in mind it has significant borrowings.
The Bottom Line On Milestone Builder Holdings’s P/E Ratio
Milestone Builder Holdings trades on a P/E ratio of 15.1, which is above the HK market average of 10.5. It has already proven it can grow earnings, but the debt levels mean it faces some risks. The relatively high P/E ratio suggests shareholders think growth will continue.
Investors have an opportunity when market expectations about a stock are wrong. As value investor Benjamin Graham famously said, ‘In the short run, the market is a voting machine but in the long run, it is a weighing machine.’ Although we don’t have analyst forecasts, you could get a better understanding of its growth by checking out this more detailed historical graph of earnings, revenue and cash flow.
You might be able to find a better buy than Milestone Builder Holdings. If you want a selection of possible winners, check out this free list of interesting companies that trade on a P/E below 20 (but have proven they can grow earnings).
To help readers see past the short term volatility of the financial market, we aim to bring you a long-term focused research analysis purely driven by fundamental data. Note that our analysis does not factor in the latest price-sensitive company announcements.
The author is an independent contributor and at the time of publication had no position in the stocks mentioned. For errors that warrant correction please contact the editor at editorial-team@simplywallst.com.
