Why We Like NetApp, Inc.’s (NASDAQ:NTAP) 24% Return On Capital Employed

Today we are going to look at NetApp, Inc. (NASDAQ:NTAP) to see whether it might be an attractive investment prospect. To be precise, we'll consider its Return On Capital Employed (ROCE), as that will inform our view of the quality of the business.
First of all, we'll work out how to calculate ROCE. Next, we'll compare it to others in its industry. Then we'll determine how its current liabilities are affecting its ROCE.
Understanding Return On Capital Employed (ROCE)
ROCE is a measure of a company's yearly pre-tax profit (its return), relative to the capital employed in the business. Generally speaking a higher ROCE is better. Overall, it is a valuable metric that has its flaws. Renowned investment researcher Michael Mauboussin has suggested that a high ROCE can indicate that 'one dollar invested in the company generates value of more than one dollar'.
How Do You Calculate Return On Capital Employed?
Analysts use this formula to calculate return on capital employed:
Return on Capital Employed = Earnings Before Interest and Tax (EBIT) ÷ (Total Assets - Current Liabilities)
Or for NetApp:
0.24 = US$1.0b ÷ (US$7.5b - US$3.2b) (Based on the trailing twelve months to October 2019.)
So, NetApp has an ROCE of 24%.
View our latest analysis for NetApp
Is NetApp's ROCE Good?
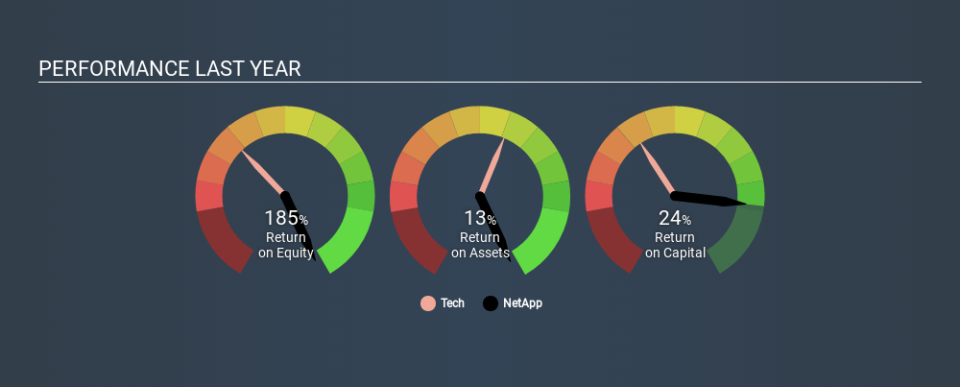
ROCE can be useful when making comparisons, such as between similar companies. In our analysis, NetApp's ROCE is meaningfully higher than the 9.2% average in the Tech industry. We would consider this a positive, as it suggests it is using capital more effectively than other similar companies. Regardless of the industry comparison, in absolute terms, NetApp's ROCE currently appears to be excellent.
In our analysis, NetApp's ROCE appears to be 24%, compared to 3 years ago, when its ROCE was 8.0%. This makes us think about whether the company has been reinvesting shrewdly. The image below shows how NetApp's ROCE compares to its industry, and you can click it to see more detail on its past growth.
Remember that this metric is backwards looking - it shows what has happened in the past, and does not accurately predict the future. Companies in cyclical industries can be difficult to understand using ROCE, as returns typically look high during boom times, and low during busts. ROCE is only a point-in-time measure. Since the future is so important for investors, you should check out our free report on analyst forecasts for NetApp.
NetApp's Current Liabilities And Their Impact On Its ROCE
Liabilities, such as supplier bills and bank overdrafts, are referred to as current liabilities if they need to be paid within 12 months. Due to the way ROCE is calculated, a high level of current liabilities makes a company look as though it has less capital employed, and thus can (sometimes unfairly) boost the ROCE. To check the impact of this, we calculate if a company has high current liabilities relative to its total assets.
NetApp has total liabilities of US$3.2b and total assets of US$7.5b. As a result, its current liabilities are equal to approximately 43% of its total assets. NetApp has a medium level of current liabilities, boosting its ROCE somewhat.
The Bottom Line On NetApp's ROCE
Even so, it has a great ROCE, and could be an attractive prospect for further research. There might be better investments than NetApp out there, but you will have to work hard to find them . These promising businesses with rapidly growing earnings might be right up your alley.
For those who like to find winning investments this free list of growing companies with recent insider purchasing, could be just the ticket.
If you spot an error that warrants correction, please contact the editor at editorial-team@simplywallst.com. This article by Simply Wall St is general in nature. It does not constitute a recommendation to buy or sell any stock, and does not take account of your objectives, or your financial situation. Simply Wall St has no position in the stocks mentioned.
We aim to bring you long-term focused research analysis driven by fundamental data. Note that our analysis may not factor in the latest price-sensitive company announcements or qualitative material. Thank you for reading.
