Why Netwealth Group Limited's (ASX:NWL) High P/E Ratio Isn't Necessarily A Bad Thing

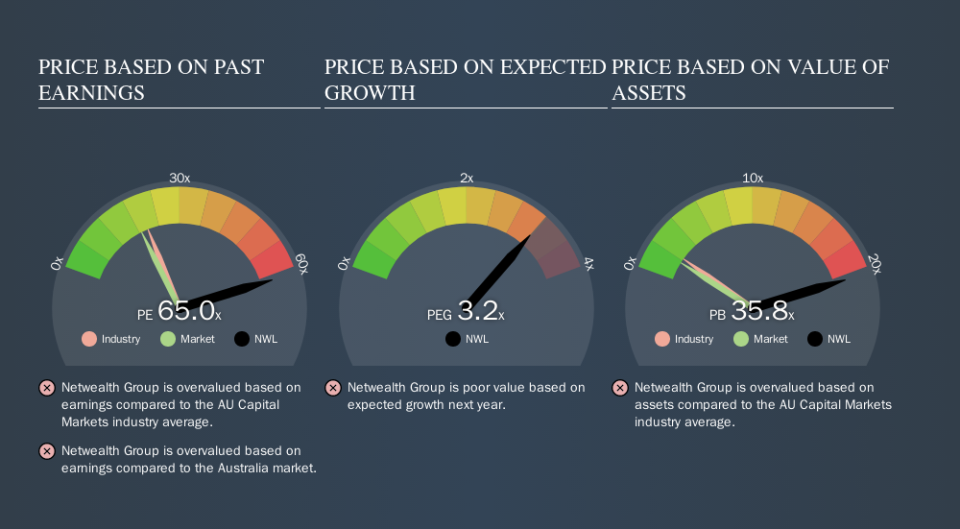
This article is written for those who want to get better at using price to earnings ratios (P/E ratios). We'll show how you can use Netwealth Group Limited's (ASX:NWL) P/E ratio to inform your assessment of the investment opportunity. Netwealth Group has a P/E ratio of 65.02, based on the last twelve months. That corresponds to an earnings yield of approximately 1.5%.
See our latest analysis for Netwealth Group
How Do I Calculate A Price To Earnings Ratio?
The formula for P/E is:
Price to Earnings Ratio = Share Price ÷ Earnings per Share (EPS)
Or for Netwealth Group:
P/E of 65.02 = A$9.63 ÷ A$0.15 (Based on the year to June 2019.)
Is A High P/E Ratio Good?
A higher P/E ratio implies that investors pay a higher price for the earning power of the business. That is not a good or a bad thing per se, but a high P/E does imply buyers are optimistic about the future.
How Does Netwealth Group's P/E Ratio Compare To Its Peers?
The P/E ratio essentially measures market expectations of a company. You can see in the image below that the average P/E (20.7) for companies in the capital markets industry is a lot lower than Netwealth Group's P/E.
Its relatively high P/E ratio indicates that Netwealth Group shareholders think it will perform better than other companies in its industry classification. The market is optimistic about the future, but that doesn't guarantee future growth. So investors should delve deeper. I like to check if company insiders have been buying or selling.
How Growth Rates Impact P/E Ratios
Earnings growth rates have a big influence on P/E ratios. If earnings are growing quickly, then the 'E' in the equation will increase faster than it would otherwise. That means unless the share price increases, the P/E will reduce in a few years. Then, a lower P/E should attract more buyers, pushing the share price up.
In the last year, Netwealth Group grew EPS like Taylor Swift grew her fan base back in 2010; the 75% gain was both fast and well deserved. The sweetener is that the annual five year growth rate of 30% is also impressive. With that kind of growth rate we would generally expect a high P/E ratio.
Remember: P/E Ratios Don't Consider The Balance Sheet
The 'Price' in P/E reflects the market capitalization of the company. Thus, the metric does not reflect cash or debt held by the company. Hypothetically, a company could reduce its future P/E ratio by spending its cash (or taking on debt) to achieve higher earnings.
While growth expenditure doesn't always pay off, the point is that it is a good option to have; but one that the P/E ratio ignores.
How Does Netwealth Group's Debt Impact Its P/E Ratio?
Since Netwealth Group holds net cash of AU$62m, it can spend on growth, justifying a higher P/E ratio than otherwise.
The Bottom Line On Netwealth Group's P/E Ratio
With a P/E ratio of 65.0, Netwealth Group is expected to grow earnings very strongly in the years to come. The excess cash it carries is the gravy on top its fast EPS growth. So based on this analysis we'd expect Netwealth Group to have a high P/E ratio.
Investors have an opportunity when market expectations about a stock are wrong. As value investor Benjamin Graham famously said, 'In the short run, the market is a voting machine but in the long run, it is a weighing machine. So this free report on the analyst consensus forecasts could help you make a master move on this stock.
You might be able to find a better buy than Netwealth Group. If you want a selection of possible winners, check out this free list of interesting companies that trade on a P/E below 20 (but have proven they can grow earnings).
We aim to bring you long-term focused research analysis driven by fundamental data. Note that our analysis may not factor in the latest price-sensitive company announcements or qualitative material.
If you spot an error that warrants correction, please contact the editor at editorial-team@simplywallst.com. This article by Simply Wall St is general in nature. It does not constitute a recommendation to buy or sell any stock, and does not take account of your objectives, or your financial situation. Simply Wall St has no position in the stocks mentioned. Thank you for reading.
