Why We’re Not Impressed By Avon Moldplast Limited’s (NSE:AVONMPL) 13% ROCE

Today we'll look at Avon Moldplast Limited (NSE:AVONMPL) and reflect on its potential as an investment. Specifically, we'll consider its Return On Capital Employed (ROCE), since that will give us an insight into how efficiently the business can generate profits from the capital it requires.
First up, we'll look at what ROCE is and how we calculate it. Next, we'll compare it to others in its industry. Last but not least, we'll look at what impact its current liabilities have on its ROCE.
Understanding Return On Capital Employed (ROCE)
ROCE is a measure of a company's yearly pre-tax profit (its return), relative to the capital employed in the business. All else being equal, a better business will have a higher ROCE. Ultimately, it is a useful but imperfect metric. Renowned investment researcher Michael Mauboussin has suggested that a high ROCE can indicate that 'one dollar invested in the company generates value of more than one dollar'.
So, How Do We Calculate ROCE?
Analysts use this formula to calculate return on capital employed:
Return on Capital Employed = Earnings Before Interest and Tax (EBIT) ÷ (Total Assets - Current Liabilities)
Or for Avon Moldplast:
0.13 = ₹17m ÷ (₹201m - ₹67m) (Based on the trailing twelve months to March 2019.)
So, Avon Moldplast has an ROCE of 13%.
See our latest analysis for Avon Moldplast
Is Avon Moldplast's ROCE Good?
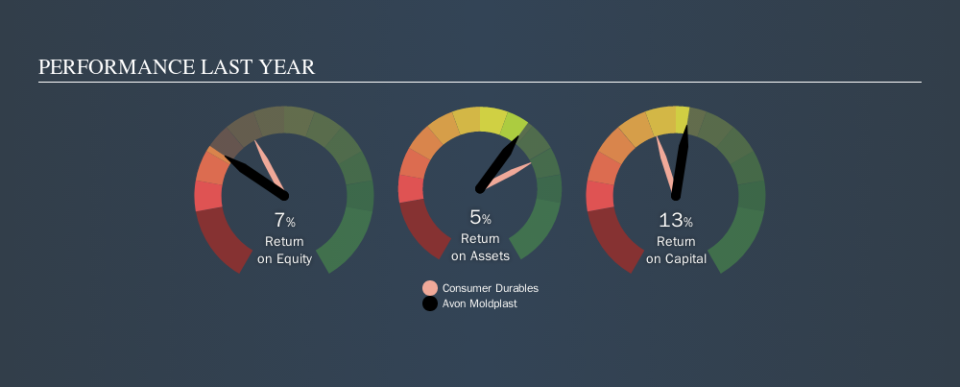
When making comparisons between similar businesses, investors may find ROCE useful. Using our data, Avon Moldplast's ROCE appears to be significantly below the 17% average in the Consumer Durables industry. This could be seen as a negative, as it suggests some competitors may be employing their capital more efficiently. Aside from the industry comparison, Avon Moldplast's ROCE is mediocre in absolute terms, considering the risk of investing in stocks versus the safety of a bank account. It is possible that there are more rewarding investments out there.
In our analysis, Avon Moldplast's ROCE appears to be 13%, compared to 3 years ago, when its ROCE was 9.9%. This makes us think about whether the company has been reinvesting shrewdly. The image below shows how Avon Moldplast's ROCE compares to its industry, and you can click it to see more detail on its past growth.
When considering ROCE, bear in mind that it reflects the past and does not necessarily predict the future. ROCE can be misleading for companies in cyclical industries, with returns looking impressive during the boom times, but very weak during the busts. ROCE is only a point-in-time measure. If Avon Moldplast is cyclical, it could make sense to check out this free graph of past earnings, revenue and cash flow.
Avon Moldplast's Current Liabilities And Their Impact On Its ROCE
Liabilities, such as supplier bills and bank overdrafts, are referred to as current liabilities if they need to be paid within 12 months. Due to the way the ROCE equation works, having large bills due in the near term can make it look as though a company has less capital employed, and thus a higher ROCE than usual. To counteract this, we check if a company has high current liabilities, relative to its total assets.
Avon Moldplast has total liabilities of ₹67m and total assets of ₹201m. Therefore its current liabilities are equivalent to approximately 34% of its total assets. Avon Moldplast's ROCE is improved somewhat by its moderate amount of current liabilities.
Our Take On Avon Moldplast's ROCE
With this level of liabilities and a mediocre ROCE, there are potentially better investments out there. But note: make sure you look for a great company, not just the first idea you come across. So take a peek at this free list of interesting companies with strong recent earnings growth (and a P/E ratio below 20).
For those who like to find winning investments this free list of growing companies with recent insider purchasing, could be just the ticket.
We aim to bring you long-term focused research analysis driven by fundamental data. Note that our analysis may not factor in the latest price-sensitive company announcements or qualitative material.
If you spot an error that warrants correction, please contact the editor at editorial-team@simplywallst.com. This article by Simply Wall St is general in nature. It does not constitute a recommendation to buy or sell any stock, and does not take account of your objectives, or your financial situation. Simply Wall St has no position in the stocks mentioned. Thank you for reading.

