Why We’re Not Impressed By C-Rad AB (publ)’s (STO:CRAD B) 4.8% ROCE

Today we'll look at C-Rad AB (publ) (STO:CRAD B) and reflect on its potential as an investment. To be precise, we'll consider its Return On Capital Employed (ROCE), as that will inform our view of the quality of the business.
First, we'll go over how we calculate ROCE. Second, we'll look at its ROCE compared to similar companies. Then we'll determine how its current liabilities are affecting its ROCE.
What is Return On Capital Employed (ROCE)?
ROCE measures the 'return' (pre-tax profit) a company generates from capital employed in its business. All else being equal, a better business will have a higher ROCE. In brief, it is a useful tool, but it is not without drawbacks. Renowned investment researcher Michael Mauboussin has suggested that a high ROCE can indicate that 'one dollar invested in the company generates value of more than one dollar'.
How Do You Calculate Return On Capital Employed?
The formula for calculating the return on capital employed is:
Return on Capital Employed = Earnings Before Interest and Tax (EBIT) ÷ (Total Assets - Current Liabilities)
Or for C-Rad:
0.048 = kr6.2m ÷ (kr178m - kr49m) (Based on the trailing twelve months to June 2019.)
Therefore, C-Rad has an ROCE of 4.8%.
View our latest analysis for C-Rad
Does C-Rad Have A Good ROCE?
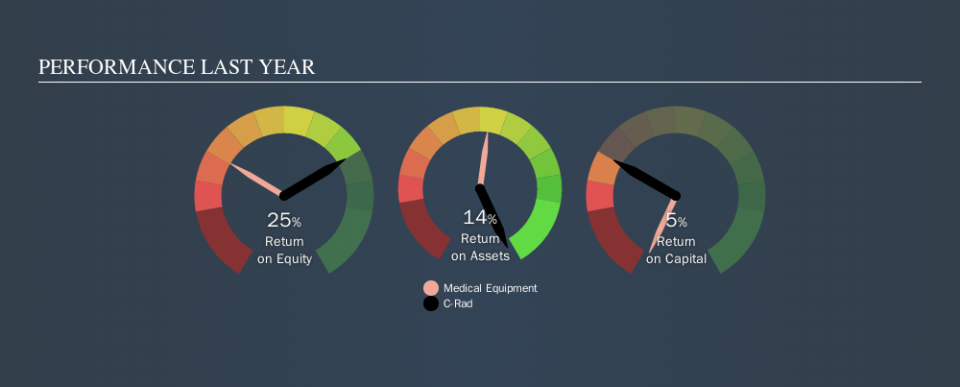
When making comparisons between similar businesses, investors may find ROCE useful. Using our data, C-Rad's ROCE appears to be significantly below the 7.0% average in the Medical Equipment industry. This performance could be negative if sustained, as it suggests the business may underperform its industry. Separate from how C-Rad stacks up against its industry, its ROCE in absolute terms is mediocre; relative to the returns on government bonds. Readers may find more attractive investment prospects elsewhere.
C-Rad reported an ROCE of 4.8% -- better than 3 years ago, when the company didn't make a profit. That implies the business has been improving. You can see in the image below how C-Rad's ROCE compares to its industry. Click to see more on past growth.
It is important to remember that ROCE shows past performance, and is not necessarily predictive. ROCE can be misleading for companies in cyclical industries, with returns looking impressive during the boom times, but very weak during the busts. ROCE is only a point-in-time measure. How cyclical is C-Rad? You can see for yourself by looking at this free graph of past earnings, revenue and cash flow.
C-Rad's Current Liabilities And Their Impact On Its ROCE
Current liabilities include invoices, such as supplier payments, short-term debt, or a tax bill, that need to be paid within 12 months. Due to the way the ROCE equation works, having large bills due in the near term can make it look as though a company has less capital employed, and thus a higher ROCE than usual. To counter this, investors can check if a company has high current liabilities relative to total assets.
C-Rad has total liabilities of kr49m and total assets of kr178m. Therefore its current liabilities are equivalent to approximately 27% of its total assets. It is good to see a restrained amount of current liabilities, as this limits the effect on ROCE.
What We Can Learn From C-Rad's ROCE
That said, C-Rad's ROCE is mediocre, there may be more attractive investments around. You might be able to find a better investment than C-Rad. If you want a selection of possible winners, check out this free list of interesting companies that trade on a P/E below 20 (but have proven they can grow earnings).
If you like to buy stocks alongside management, then you might just love this free list of companies. (Hint: insiders have been buying them).
We aim to bring you long-term focused research analysis driven by fundamental data. Note that our analysis may not factor in the latest price-sensitive company announcements or qualitative material.
If you spot an error that warrants correction, please contact the editor at editorial-team@simplywallst.com. This article by Simply Wall St is general in nature. It does not constitute a recommendation to buy or sell any stock, and does not take account of your objectives, or your financial situation. Simply Wall St has no position in the stocks mentioned. Thank you for reading.
