Why We’re Not Impressed By EL. D. Mouzakis S.A.’s (ATH:MOYZK) 1.1% ROCE

Today we are going to look at EL. D. Mouzakis S.A. (ATH:MOYZK) to see whether it might be an attractive investment prospect. Specifically, we'll consider its Return On Capital Employed (ROCE), since that will give us an insight into how efficiently the business can generate profits from the capital it requires.
Firstly, we'll go over how we calculate ROCE. Next, we'll compare it to others in its industry. Finally, we'll look at how its current liabilities affect its ROCE.
Understanding Return On Capital Employed (ROCE)
ROCE measures the 'return' (pre-tax profit) a company generates from capital employed in its business. All else being equal, a better business will have a higher ROCE. In brief, it is a useful tool, but it is not without drawbacks. Author Edwin Whiting says to be careful when comparing the ROCE of different businesses, since 'No two businesses are exactly alike.
So, How Do We Calculate ROCE?
The formula for calculating the return on capital employed is:
Return on Capital Employed = Earnings Before Interest and Tax (EBIT) ÷ (Total Assets - Current Liabilities)
Or for EL. D. Mouzakis:
0.011 = €625k ÷ (€59m - €1.4m) (Based on the trailing twelve months to June 2019.)
Therefore, EL. D. Mouzakis has an ROCE of 1.1%.
See our latest analysis for EL. D. Mouzakis
Does EL. D. Mouzakis Have A Good ROCE?
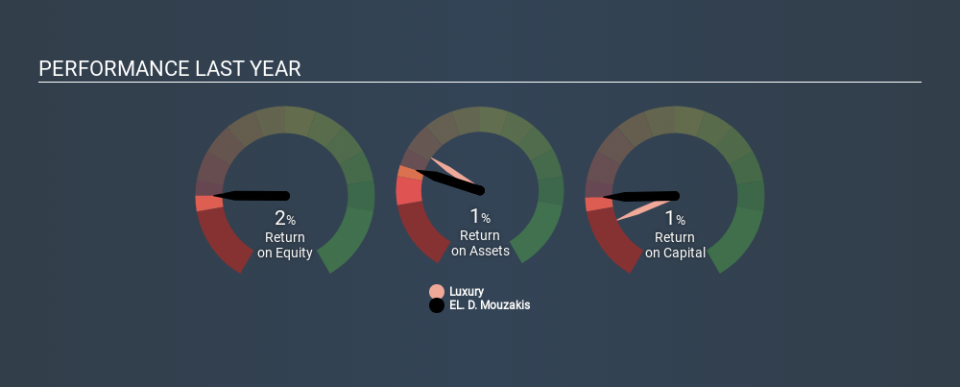
ROCE is commonly used for comparing the performance of similar businesses. In this analysis, EL. D. Mouzakis's ROCE appears meaningfully below the 1.6% average reported by the Luxury industry. This performance could be negative if sustained, as it suggests the business may underperform its industry. Regardless of how EL. D. Mouzakis stacks up against its industry, its ROCE in absolute terms is quite low (especially compared to a bank account). It is likely that there are more attractive prospects out there.
EL. D. Mouzakis delivered an ROCE of 1.1%, which is better than 3 years ago, as was making losses back then. That suggests the business has returned to profitability. You can see in the image below how EL. D. Mouzakis's ROCE compares to its industry. Click to see more on past growth.
It is important to remember that ROCE shows past performance, and is not necessarily predictive. ROCE can be deceptive for cyclical businesses, as returns can look incredible in boom times, and terribly low in downturns. ROCE is, after all, simply a snap shot of a single year. How cyclical is EL. D. Mouzakis? You can see for yourself by looking at this free graph of past earnings, revenue and cash flow.
Do EL. D. Mouzakis's Current Liabilities Skew Its ROCE?
Short term (or current) liabilities, are things like supplier invoices, overdrafts, or tax bills that need to be paid within 12 months. Due to the way ROCE is calculated, a high level of current liabilities makes a company look as though it has less capital employed, and thus can (sometimes unfairly) boost the ROCE. To counteract this, we check if a company has high current liabilities, relative to its total assets.
EL. D. Mouzakis has total assets of €59m and current liabilities of €1.4m. Therefore its current liabilities are equivalent to approximately 2.3% of its total assets. EL. D. Mouzakis has very few current liabilities, which have a minimal effect on its already low ROCE.
The Bottom Line On EL. D. Mouzakis's ROCE
Nonetheless, there may be better places to invest your capital. But note: make sure you look for a great company, not just the first idea you come across. So take a peek at this free list of interesting companies with strong recent earnings growth (and a P/E ratio below 20).
If you like to buy stocks alongside management, then you might just love this free list of companies. (Hint: insiders have been buying them).
If you spot an error that warrants correction, please contact the editor at editorial-team@simplywallst.com. This article by Simply Wall St is general in nature. It does not constitute a recommendation to buy or sell any stock, and does not take account of your objectives, or your financial situation. Simply Wall St has no position in the stocks mentioned.
We aim to bring you long-term focused research analysis driven by fundamental data. Note that our analysis may not factor in the latest price-sensitive company announcements or qualitative material. Thank you for reading.

