Why We’re Not Impressed By Ircon International Limited’s (NSE:IRCON) 5.2% ROCE

Today we'll look at Ircon International Limited (NSE:IRCON) and reflect on its potential as an investment. To be precise, we'll consider its Return On Capital Employed (ROCE), as that will inform our view of the quality of the business.
Firstly, we'll go over how we calculate ROCE. Then we'll compare its ROCE to similar companies. Finally, we'll look at how its current liabilities affect its ROCE.
What is Return On Capital Employed (ROCE)?
ROCE measures the 'return' (pre-tax profit) a company generates from capital employed in its business. Generally speaking a higher ROCE is better. Overall, it is a valuable metric that has its flaws. Author Edwin Whiting says to be careful when comparing the ROCE of different businesses, since 'No two businesses are exactly alike.'
So, How Do We Calculate ROCE?
Analysts use this formula to calculate return on capital employed:
Return on Capital Employed = Earnings Before Interest and Tax (EBIT) ÷ (Total Assets - Current Liabilities)
Or for Ircon International:
0.052 = ₹4.3b ÷ (₹128b - ₹45b) (Based on the trailing twelve months to March 2018.)
So, Ircon International has an ROCE of 5.2%.
Want to participate in a short research study? Help shape the future of investing tools and you could win a $250 gift card!
See our latest analysis for Ircon International
Is Ircon International's ROCE Good?
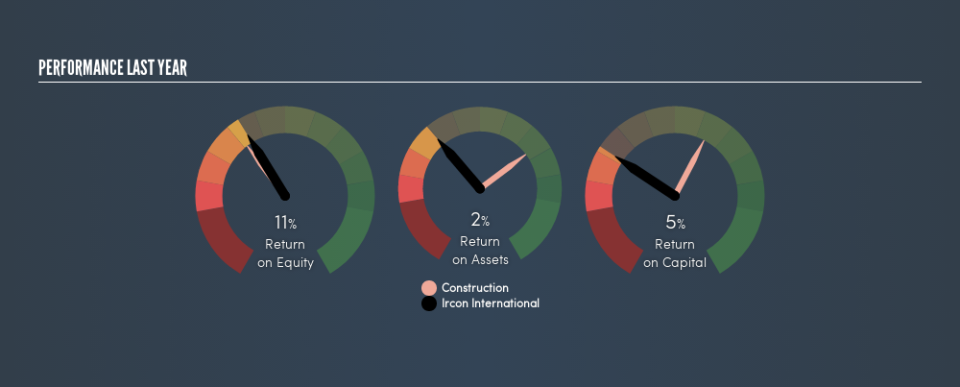
When making comparisons between similar businesses, investors may find ROCE useful. Using our data, Ircon International's ROCE appears to be significantly below the 13% average in the Construction industry. This performance is not ideal, as it suggests the company may not be deploying its capital as effectively as some competitors. Putting aside Ircon International's performance relative to its industry, its ROCE in absolute terms is poor - considering the risk of owning stocks compared to government bonds. Readers may wish to look for more rewarding investments.
Ircon International's current ROCE of 5.2% is lower than 3 years ago, when the company reported a 15% ROCE. Therefore we wonder if the company is facing new headwinds.
When considering ROCE, bear in mind that it reflects the past and does not necessarily predict the future. ROCE can be misleading for companies in cyclical industries, with returns looking impressive during the boom times, but very weak during the busts. This is because ROCE only looks at one year, instead of considering returns across a whole cycle. If Ircon International is cyclical, it could make sense to check out this free graph of past earnings, revenue and cash flow.
How Ircon International's Current Liabilities Impact Its ROCE
Current liabilities are short term bills and invoices that need to be paid in 12 months or less. The ROCE equation subtracts current liabilities from capital employed, so a company with a lot of current liabilities appears to have less capital employed, and a higher ROCE than otherwise. To counteract this, we check if a company has high current liabilities, relative to its total assets.
Ircon International has total assets of ₹128b and current liabilities of ₹45b. Therefore its current liabilities are equivalent to approximately 35% of its total assets. Ircon International has a medium level of current liabilities (boosting the ROCE somewhat), and a low ROCE.
The Bottom Line On Ircon International's ROCE
This company may not be the most attractive investment prospect. Of course, you might also be able to find a better stock than Ircon International. So you may wish to see this free collection of other companies that have grown earnings strongly.
For those who like to find winning investments this free list of growing companies with recent insider purchasing, could be just the ticket.
We aim to bring you long-term focused research analysis driven by fundamental data. Note that our analysis may not factor in the latest price-sensitive company announcements or qualitative material.
If you spot an error that warrants correction, please contact the editor at editorial-team@simplywallst.com. This article by Simply Wall St is general in nature. It does not constitute a recommendation to buy or sell any stock, and does not take account of your objectives, or your financial situation. Simply Wall St has no position in the stocks mentioned. Thank you for reading.
