Why We’re Not Impressed By paragon GmbH & Co. KGaA’s (ETR:PGN) 4.8% ROCE

Want to participate in a short research study? Help shape the future of investing tools and you could win a $250 gift card!
Today we'll evaluate paragon GmbH & Co. KGaA (ETR:PGN) to determine whether it could have potential as an investment idea. Specifically, we're going to calculate its Return On Capital Employed (ROCE), in the hopes of getting some insight into the business.
First, we'll go over how we calculate ROCE. Next, we'll compare it to others in its industry. Last but not least, we'll look at what impact its current liabilities have on its ROCE.
Understanding Return On Capital Employed (ROCE)
ROCE is a metric for evaluating how much pre-tax income (in percentage terms) a company earns on the capital invested in its business. All else being equal, a better business will have a higher ROCE. Overall, it is a valuable metric that has its flaws. Author Edwin Whiting says to be careful when comparing the ROCE of different businesses, since 'No two businesses are exactly alike.'
How Do You Calculate Return On Capital Employed?
Analysts use this formula to calculate return on capital employed:
Return on Capital Employed = Earnings Before Interest and Tax (EBIT) ÷ (Total Assets - Current Liabilities)
Or for paragon GmbH KGaA:
0.048 = €14m ÷ (€361m - €77m) (Based on the trailing twelve months to March 2019.)
So, paragon GmbH KGaA has an ROCE of 4.8%.
Check out our latest analysis for paragon GmbH KGaA
Is paragon GmbH KGaA's ROCE Good?
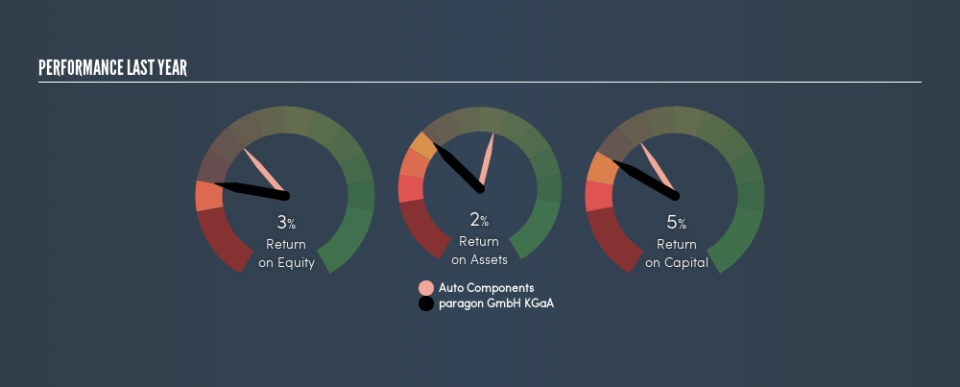
When making comparisons between similar businesses, investors may find ROCE useful. We can see paragon GmbH KGaA's ROCE is meaningfully below the Auto Components industry average of 9.1%. This could be seen as a negative, as it suggests some competitors may be employing their capital more efficiently. Aside from the industry comparison, paragon GmbH KGaA's ROCE is mediocre in absolute terms, considering the risk of investing in stocks versus the safety of a bank account. Investors may wish to consider higher-performing investments.
As we can see, paragon GmbH KGaA currently has an ROCE of 4.8%, less than the 8.1% it reported 3 years ago. Therefore we wonder if the company is facing new headwinds.
It is important to remember that ROCE shows past performance, and is not necessarily predictive. ROCE can be deceptive for cyclical businesses, as returns can look incredible in boom times, and terribly low in downturns. This is because ROCE only looks at one year, instead of considering returns across a whole cycle. Since the future is so important for investors, you should check out our free report on analyst forecasts for paragon GmbH KGaA.
paragon GmbH KGaA's Current Liabilities And Their Impact On Its ROCE
Current liabilities are short term bills and invoices that need to be paid in 12 months or less. The ROCE equation subtracts current liabilities from capital employed, so a company with a lot of current liabilities appears to have less capital employed, and a higher ROCE than otherwise. To counter this, investors can check if a company has high current liabilities relative to total assets.
paragon GmbH KGaA has total liabilities of €77m and total assets of €361m. Therefore its current liabilities are equivalent to approximately 21% of its total assets. This very reasonable level of current liabilities would not boost the ROCE by much.
Our Take On paragon GmbH KGaA's ROCE
If paragon GmbH KGaA continues to earn an uninspiring ROCE, there may be better places to invest. But note: make sure you look for a great company, not just the first idea you come across. So take a peek at this free list of interesting companies with strong recent earnings growth (and a P/E ratio below 20).
I will like paragon GmbH KGaA better if I see some big insider buys. While we wait, check out this free list of growing companies with considerable, recent, insider buying.
We aim to bring you long-term focused research analysis driven by fundamental data. Note that our analysis may not factor in the latest price-sensitive company announcements or qualitative material.
If you spot an error that warrants correction, please contact the editor at editorial-team@simplywallst.com. This article by Simply Wall St is general in nature. It does not constitute a recommendation to buy or sell any stock, and does not take account of your objectives, or your financial situation. Simply Wall St has no position in the stocks mentioned. Thank you for reading.
