Why We’re Not Impressed By The Williams Companies, Inc.’s (NYSE:WMB) 5.4% ROCE

Today we are going to look at The Williams Companies, Inc. (NYSE:WMB) to see whether it might be an attractive investment prospect. Specifically, we're going to calculate its Return On Capital Employed (ROCE), in the hopes of getting some insight into the business.
First of all, we'll work out how to calculate ROCE. Second, we'll look at its ROCE compared to similar companies. Then we'll determine how its current liabilities are affecting its ROCE.
What is Return On Capital Employed (ROCE)?
ROCE is a measure of a company's yearly pre-tax profit (its return), relative to the capital employed in the business. All else being equal, a better business will have a higher ROCE. Ultimately, it is a useful but imperfect metric. Author Edwin Whiting says to be careful when comparing the ROCE of different businesses, since 'No two businesses are exactly alike.
How Do You Calculate Return On Capital Employed?
The formula for calculating the return on capital employed is:
Return on Capital Employed = Earnings Before Interest and Tax (EBIT) ÷ (Total Assets - Current Liabilities)
Or for Williams Companies:
0.054 = US$2.3b ÷ (US$46b - US$3.3b) (Based on the trailing twelve months to September 2019.)
So, Williams Companies has an ROCE of 5.4%.
Check out our latest analysis for Williams Companies
Is Williams Companies's ROCE Good?
ROCE is commonly used for comparing the performance of similar businesses. Using our data, Williams Companies's ROCE appears to be significantly below the 9.0% average in the Oil and Gas industry. This performance is not ideal, as it suggests the company may not be deploying its capital as effectively as some competitors. Separate from how Williams Companies stacks up against its industry, its ROCE in absolute terms is mediocre; relative to the returns on government bonds. It is possible that there are more rewarding investments out there.
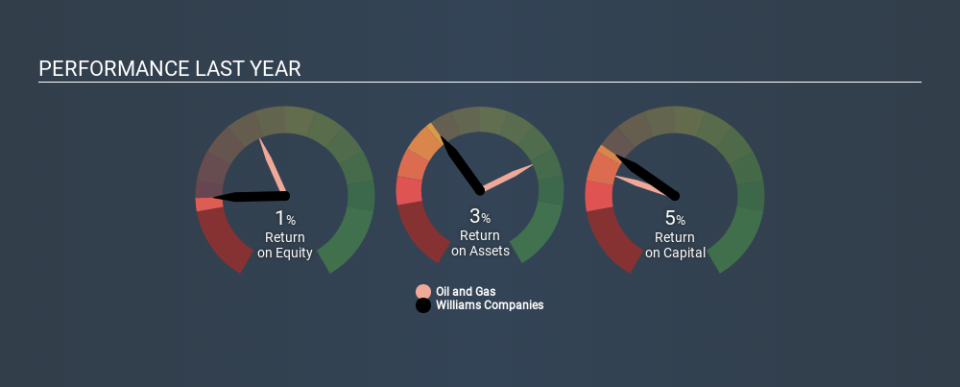
Our data shows that Williams Companies currently has an ROCE of 5.4%, compared to its ROCE of 3.4% 3 years ago. This makes us think the business might be improving. You can see in the image below how Williams Companies's ROCE compares to its industry. Click to see more on past growth.
When considering ROCE, bear in mind that it reflects the past and does not necessarily predict the future. ROCE can be deceptive for cyclical businesses, as returns can look incredible in boom times, and terribly low in downturns. ROCE is only a point-in-time measure. Given the industry it operates in, Williams Companies could be considered cyclical. Since the future is so important for investors, you should check out our free report on analyst forecasts for Williams Companies.
How Williams Companies's Current Liabilities Impact Its ROCE
Short term (or current) liabilities, are things like supplier invoices, overdrafts, or tax bills that need to be paid within 12 months. The ROCE equation subtracts current liabilities from capital employed, so a company with a lot of current liabilities appears to have less capital employed, and a higher ROCE than otherwise. To counteract this, we check if a company has high current liabilities, relative to its total assets.
Williams Companies has total assets of US$46b and current liabilities of US$3.3b. Therefore its current liabilities are equivalent to approximately 7.2% of its total assets. Williams Companies reports few current liabilities, which have a negligible impact on its unremarkable ROCE.
What We Can Learn From Williams Companies's ROCE
Based on this information, Williams Companies appears to be a mediocre business. Of course, you might find a fantastic investment by looking at a few good candidates. So take a peek at this free list of companies with modest (or no) debt, trading on a P/E below 20.
If you are like me, then you will not want to miss this free list of growing companies that insiders are buying.
If you spot an error that warrants correction, please contact the editor at editorial-team@simplywallst.com. This article by Simply Wall St is general in nature. It does not constitute a recommendation to buy or sell any stock, and does not take account of your objectives, or your financial situation. Simply Wall St has no position in the stocks mentioned.
We aim to bring you long-term focused research analysis driven by fundamental data. Note that our analysis may not factor in the latest price-sensitive company announcements or qualitative material. Thank you for reading.

