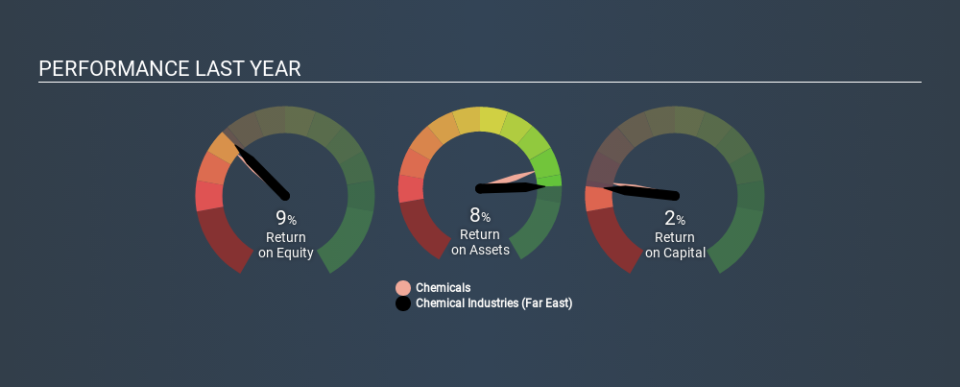
Why We’re Not Keen On Chemical Industries (Far East) Limited’s (SGX:C05) 2.0% Return On Capital

Today we'll evaluate Chemical Industries (Far East) Limited (SGX:C05) to determine whether it could have potential as an investment idea. To be precise, we'll consider its Return On Capital Employed (ROCE), as that will inform our view of the quality of the business.
Firstly, we'll go over how we calculate ROCE. Second, we'll look at its ROCE compared to similar companies. Then we'll determine how its current liabilities are affecting its ROCE.
Return On Capital Employed (ROCE): What is it?
ROCE measures the 'return' (pre-tax profit) a company generates from capital employed in its business. Generally speaking a higher ROCE is better. Overall, it is a valuable metric that has its flaws. Renowned investment researcher Michael Mauboussin has suggested that a high ROCE can indicate that 'one dollar invested in the company generates value of more than one dollar'.
So, How Do We Calculate ROCE?
The formula for calculating the return on capital employed is:
Return on Capital Employed = Earnings Before Interest and Tax (EBIT) ÷ (Total Assets - Current Liabilities)
Or for Chemical Industries (Far East):
0.02 = S$2.5m ÷ (S$136m - S$9.4m) (Based on the trailing twelve months to September 2019.)
So, Chemical Industries (Far East) has an ROCE of 2.0%.
See our latest analysis for Chemical Industries (Far East)
Is Chemical Industries (Far East)'s ROCE Good?
ROCE can be useful when making comparisons, such as between similar companies. In this analysis, Chemical Industries (Far East)'s ROCE appears meaningfully below the 6.5% average reported by the Chemicals industry. This could be seen as a negative, as it suggests some competitors may be employing their capital more efficiently. Regardless of how Chemical Industries (Far East) stacks up against its industry, its ROCE in absolute terms is quite low (especially compared to a bank account). There are potentially more appealing investments elsewhere.
You can click on the image below to see (in greater detail) how Chemical Industries (Far East)'s past growth compares to other companies.
When considering ROCE, bear in mind that it reflects the past and does not necessarily predict the future. Companies in cyclical industries can be difficult to understand using ROCE, as returns typically look high during boom times, and low during busts. ROCE is only a point-in-time measure. If Chemical Industries (Far East) is cyclical, it could make sense to check out this free graph of past earnings, revenue and cash flow.
How Chemical Industries (Far East)'s Current Liabilities Impact Its ROCE
Current liabilities are short term bills and invoices that need to be paid in 12 months or less. Due to the way the ROCE equation works, having large bills due in the near term can make it look as though a company has less capital employed, and thus a higher ROCE than usual. To counter this, investors can check if a company has high current liabilities relative to total assets.
Chemical Industries (Far East) has total assets of S$136m and current liabilities of S$9.4m. As a result, its current liabilities are equal to approximately 6.9% of its total assets. Chemical Industries (Far East) has a low level of current liabilities, which have a negligible impact on its already low ROCE.
What We Can Learn From Chemical Industries (Far East)'s ROCE
Nonetheless, there may be better places to invest your capital. Of course, you might also be able to find a better stock than Chemical Industries (Far East). So you may wish to see this free collection of other companies that have grown earnings strongly.
I will like Chemical Industries (Far East) better if I see some big insider buys. While we wait, check out this free list of growing companies with considerable, recent, insider buying.
If you spot an error that warrants correction, please contact the editor at editorial-team@simplywallst.com. This article by Simply Wall St is general in nature. It does not constitute a recommendation to buy or sell any stock, and does not take account of your objectives, or your financial situation. Simply Wall St has no position in the stocks mentioned.
We aim to bring you long-term focused research analysis driven by fundamental data. Note that our analysis may not factor in the latest price-sensitive company announcements or qualitative material. Thank you for reading.

