Why We’re Not Keen On L.B. Foster Company’s (NASDAQ:FSTR) 8.5% Return On Capital

Today we are going to look at L.B. Foster Company (NASDAQ:FSTR) to see whether it might be an attractive investment prospect. Specifically, we're going to calculate its Return On Capital Employed (ROCE), in the hopes of getting some insight into the business.
First up, we'll look at what ROCE is and how we calculate it. Next, we'll compare it to others in its industry. Finally, we'll look at how its current liabilities affect its ROCE.
Return On Capital Employed (ROCE): What is it?
ROCE is a measure of a company's yearly pre-tax profit (its return), relative to the capital employed in the business. Generally speaking a higher ROCE is better. In brief, it is a useful tool, but it is not without drawbacks. Author Edwin Whiting says to be careful when comparing the ROCE of different businesses, since 'No two businesses are exactly alike.
How Do You Calculate Return On Capital Employed?
Analysts use this formula to calculate return on capital employed:
Return on Capital Employed = Earnings Before Interest and Tax (EBIT) ÷ (Total Assets - Current Liabilities)
Or for L.B. Foster:
0.085 = US$25m ÷ (US$405m - US$117m) (Based on the trailing twelve months to December 2019.)
So, L.B. Foster has an ROCE of 8.5%.
Check out our latest analysis for L.B. Foster
Does L.B. Foster Have A Good ROCE?
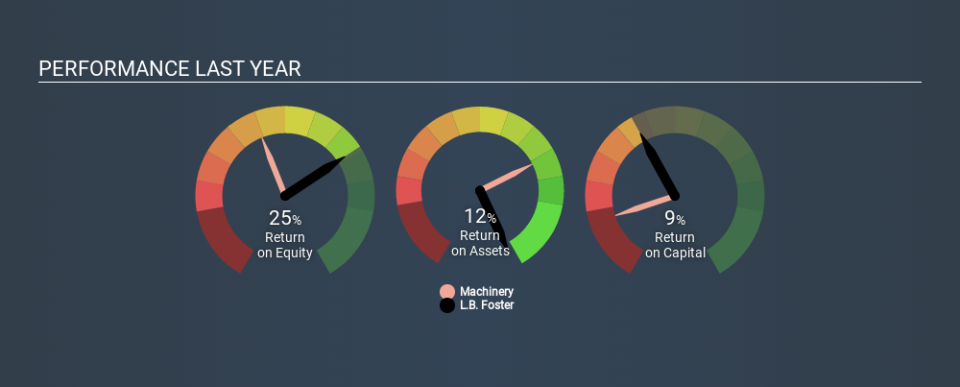
ROCE is commonly used for comparing the performance of similar businesses. Using our data, L.B. Foster's ROCE appears to be significantly below the 11% average in the Machinery industry. This performance is not ideal, as it suggests the company may not be deploying its capital as effectively as some competitors. Separate from how L.B. Foster stacks up against its industry, its ROCE in absolute terms is mediocre; relative to the returns on government bonds. Readers may find more attractive investment prospects elsewhere.
L.B. Foster has an ROCE of 8.5%, but it didn't have an ROCE 3 years ago, since it was unprofitable. That implies the business has been improving. You can click on the image below to see (in greater detail) how L.B. Foster's past growth compares to other companies.
When considering this metric, keep in mind that it is backwards looking, and not necessarily predictive. ROCE can be misleading for companies in cyclical industries, with returns looking impressive during the boom times, but very weak during the busts. This is because ROCE only looks at one year, instead of considering returns across a whole cycle. What happens in the future is pretty important for investors, so we have prepared a free report on analyst forecasts for L.B. Foster.
L.B. Foster's Current Liabilities And Their Impact On Its ROCE
Current liabilities are short term bills and invoices that need to be paid in 12 months or less. Due to the way the ROCE equation works, having large bills due in the near term can make it look as though a company has less capital employed, and thus a higher ROCE than usual. To counter this, investors can check if a company has high current liabilities relative to total assets.
L.B. Foster has current liabilities of US$117m and total assets of US$405m. Therefore its current liabilities are equivalent to approximately 29% of its total assets. This is a modest level of current liabilities, which would only have a small effect on ROCE.
The Bottom Line On L.B. Foster's ROCE
With that in mind, we're not overly impressed with L.B. Foster's ROCE, so it may not be the most appealing prospect. You might be able to find a better investment than L.B. Foster. If you want a selection of possible winners, check out this free list of interesting companies that trade on a P/E below 20 (but have proven they can grow earnings).
If you are like me, then you will not want to miss this free list of growing companies that insiders are buying.
If you spot an error that warrants correction, please contact the editor at editorial-team@simplywallst.com. This article by Simply Wall St is general in nature. It does not constitute a recommendation to buy or sell any stock, and does not take account of your objectives, or your financial situation. Simply Wall St has no position in the stocks mentioned.
We aim to bring you long-term focused research analysis driven by fundamental data. Note that our analysis may not factor in the latest price-sensitive company announcements or qualitative material. Thank you for reading.
