Why We’re Not Keen On Win Hanverky Holdings Limited’s (HKG:3322) 5.0% Return On Capital

Today we'll look at Win Hanverky Holdings Limited (HKG:3322) and reflect on its potential as an investment. Specifically, we're going to calculate its Return On Capital Employed (ROCE), in the hopes of getting some insight into the business.
First up, we'll look at what ROCE is and how we calculate it. Then we'll compare its ROCE to similar companies. And finally, we'll look at how its current liabilities are impacting its ROCE.
Understanding Return On Capital Employed (ROCE)
ROCE is a metric for evaluating how much pre-tax income (in percentage terms) a company earns on the capital invested in its business. All else being equal, a better business will have a higher ROCE. Ultimately, it is a useful but imperfect metric. Author Edwin Whiting says to be careful when comparing the ROCE of different businesses, since 'No two businesses are exactly alike.
How Do You Calculate Return On Capital Employed?
Analysts use this formula to calculate return on capital employed:
Return on Capital Employed = Earnings Before Interest and Tax (EBIT) ÷ (Total Assets - Current Liabilities)
Or for Win Hanverky Holdings:
0.05 = HK$129m ÷ (HK$4.3b - HK$1.7b) (Based on the trailing twelve months to June 2019.)
So, Win Hanverky Holdings has an ROCE of 5.0%.
View our latest analysis for Win Hanverky Holdings
Does Win Hanverky Holdings Have A Good ROCE?
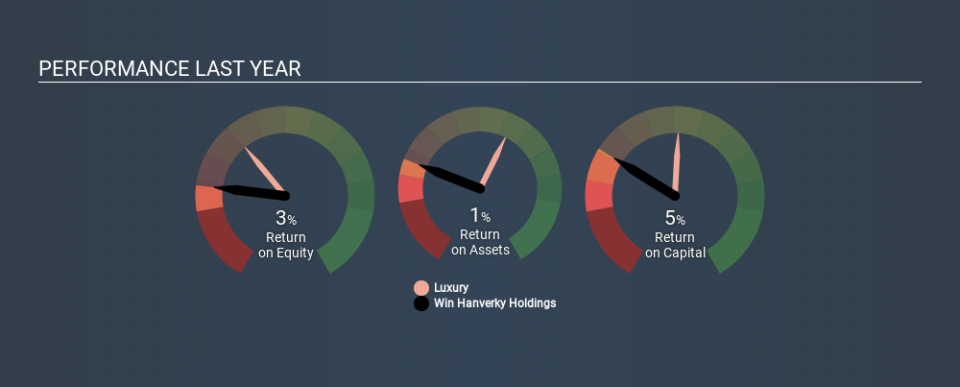
One way to assess ROCE is to compare similar companies. We can see Win Hanverky Holdings's ROCE is meaningfully below the Luxury industry average of 9.6%. This could be seen as a negative, as it suggests some competitors may be employing their capital more efficiently. Aside from the industry comparison, Win Hanverky Holdings's ROCE is mediocre in absolute terms, considering the risk of investing in stocks versus the safety of a bank account. Investors may wish to consider higher-performing investments.
We can see that, Win Hanverky Holdings currently has an ROCE of 5.0%, less than the 12% it reported 3 years ago. Therefore we wonder if the company is facing new headwinds. The image below shows how Win Hanverky Holdings's ROCE compares to its industry, and you can click it to see more detail on its past growth.
When considering this metric, keep in mind that it is backwards looking, and not necessarily predictive. Companies in cyclical industries can be difficult to understand using ROCE, as returns typically look high during boom times, and low during busts. This is because ROCE only looks at one year, instead of considering returns across a whole cycle. How cyclical is Win Hanverky Holdings? You can see for yourself by looking at this free graph of past earnings, revenue and cash flow.
Win Hanverky Holdings's Current Liabilities And Their Impact On Its ROCE
Short term (or current) liabilities, are things like supplier invoices, overdrafts, or tax bills that need to be paid within 12 months. Due to the way ROCE is calculated, a high level of current liabilities makes a company look as though it has less capital employed, and thus can (sometimes unfairly) boost the ROCE. To counteract this, we check if a company has high current liabilities, relative to its total assets.
Win Hanverky Holdings has total assets of HK$4.3b and current liabilities of HK$1.7b. Therefore its current liabilities are equivalent to approximately 40% of its total assets. Win Hanverky Holdings's ROCE is improved somewhat by its moderate amount of current liabilities.
Our Take On Win Hanverky Holdings's ROCE
Unfortunately, its ROCE is still uninspiring, and there are potentially more attractive prospects out there. Of course, you might find a fantastic investment by looking at a few good candidates. So take a peek at this free list of companies with modest (or no) debt, trading on a P/E below 20.
I will like Win Hanverky Holdings better if I see some big insider buys. While we wait, check out this free list of growing companies with considerable, recent, insider buying.
If you spot an error that warrants correction, please contact the editor at editorial-team@simplywallst.com. This article by Simply Wall St is general in nature. It does not constitute a recommendation to buy or sell any stock, and does not take account of your objectives, or your financial situation. Simply Wall St has no position in the stocks mentioned.
We aim to bring you long-term focused research analysis driven by fundamental data. Note that our analysis may not factor in the latest price-sensitive company announcements or qualitative material. Thank you for reading.

