Why NZME Limited’s (NZSE:NZM) Return On Capital Employed Looks Uninspiring

Want to participate in a short research study? Help shape the future of investing tools and you could win a $250 gift card!
Today we are going to look at NZME Limited (NZSE:NZM) to see whether it might be an attractive investment prospect. Specifically, we're going to calculate its Return On Capital Employed (ROCE), in the hopes of getting some insight into the business.
First up, we'll look at what ROCE is and how we calculate it. Second, we'll look at its ROCE compared to similar companies. Last but not least, we'll look at what impact its current liabilities have on its ROCE.
Understanding Return On Capital Employed (ROCE)
ROCE measures the 'return' (pre-tax profit) a company generates from capital employed in its business. In general, businesses with a higher ROCE are usually better quality. Ultimately, it is a useful but imperfect metric. Renowned investment researcher Michael Mauboussin has suggested that a high ROCE can indicate that 'one dollar invested in the company generates value of more than one dollar'.
So, How Do We Calculate ROCE?
The formula for calculating the return on capital employed is:
Return on Capital Employed = Earnings Before Interest and Tax (EBIT) ÷ (Total Assets - Current Liabilities)
Or for NZME:
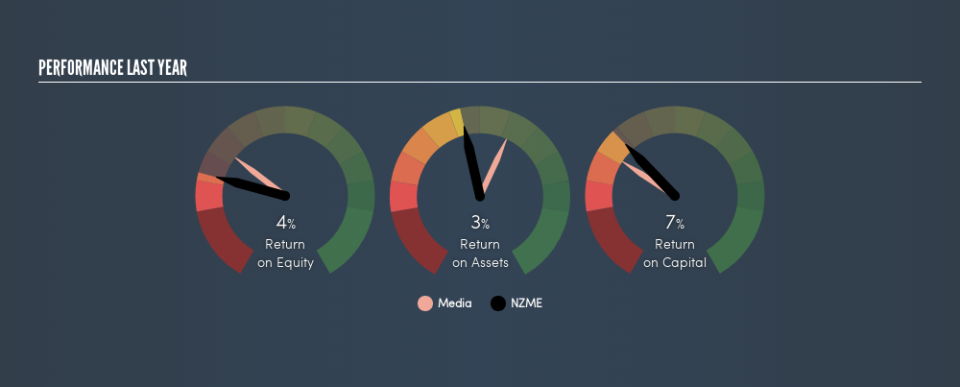
0.068 = NZ$28m ÷ (NZ$463m - NZ$52m) (Based on the trailing twelve months to December 2018.)
Therefore, NZME has an ROCE of 6.8%.
View our latest analysis for NZME
Does NZME Have A Good ROCE?
ROCE can be useful when making comparisons, such as between similar companies. In this analysis, NZME's ROCE appears meaningfully below the 8.6% average reported by the Media industry. This performance is not ideal, as it suggests the company may not be deploying its capital as effectively as some competitors. Aside from the industry comparison, NZME's ROCE is mediocre in absolute terms, considering the risk of investing in stocks versus the safety of a bank account. Investors may wish to consider higher-performing investments.
In our analysis, NZME's ROCE appears to be 6.8%, compared to 3 years ago, when its ROCE was 5.2%. This makes us think about whether the company has been reinvesting shrewdly.
When considering this metric, keep in mind that it is backwards looking, and not necessarily predictive. ROCE can be misleading for companies in cyclical industries, with returns looking impressive during the boom times, but very weak during the busts. ROCE is only a point-in-time measure. What happens in the future is pretty important for investors, so we have prepared a free report on analyst forecasts for NZME.
How NZME's Current Liabilities Impact Its ROCE
Current liabilities include invoices, such as supplier payments, short-term debt, or a tax bill, that need to be paid within 12 months. The ROCE equation subtracts current liabilities from capital employed, so a company with a lot of current liabilities appears to have less capital employed, and a higher ROCE than otherwise. To counteract this, we check if a company has high current liabilities, relative to its total assets.
NZME has total liabilities of NZ$52m and total assets of NZ$463m. Therefore its current liabilities are equivalent to approximately 11% of its total assets. This very reasonable level of current liabilities would not boost the ROCE by much.
What We Can Learn From NZME's ROCE
With that in mind, we're not overly impressed with NZME's ROCE, so it may not be the most appealing prospect. Of course, you might also be able to find a better stock than NZME. So you may wish to see this free collection of other companies that have grown earnings strongly.
If you are like me, then you will not want to miss this free list of growing companies that insiders are buying.
We aim to bring you long-term focused research analysis driven by fundamental data. Note that our analysis may not factor in the latest price-sensitive company announcements or qualitative material.
If you spot an error that warrants correction, please contact the editor at editorial-team@simplywallst.com. This article by Simply Wall St is general in nature. It does not constitute a recommendation to buy or sell any stock, and does not take account of your objectives, or your financial situation. Simply Wall St has no position in the stocks mentioned. Thank you for reading.
