Why Oriola Oyj’s (HEL:OKDBV) Return On Capital Employed Might Be A Concern

Today we'll evaluate Oriola Oyj (HEL:OKDBV) to determine whether it could have potential as an investment idea. Specifically, we're going to calculate its Return On Capital Employed (ROCE), in the hopes of getting some insight into the business.
First of all, we'll work out how to calculate ROCE. Next, we'll compare it to others in its industry. Then we'll determine how its current liabilities are affecting its ROCE.
Return On Capital Employed (ROCE): What is it?
ROCE measures the amount of pre-tax profits a company can generate from the capital employed in its business. Generally speaking a higher ROCE is better. Ultimately, it is a useful but imperfect metric. Renowned investment researcher Michael Mauboussin has suggested that a high ROCE can indicate that 'one dollar invested in the company generates value of more than one dollar'.
So, How Do We Calculate ROCE?
The formula for calculating the return on capital employed is:
Return on Capital Employed = Earnings Before Interest and Tax (EBIT) ÷ (Total Assets - Current Liabilities)
Or for Oriola Oyj:
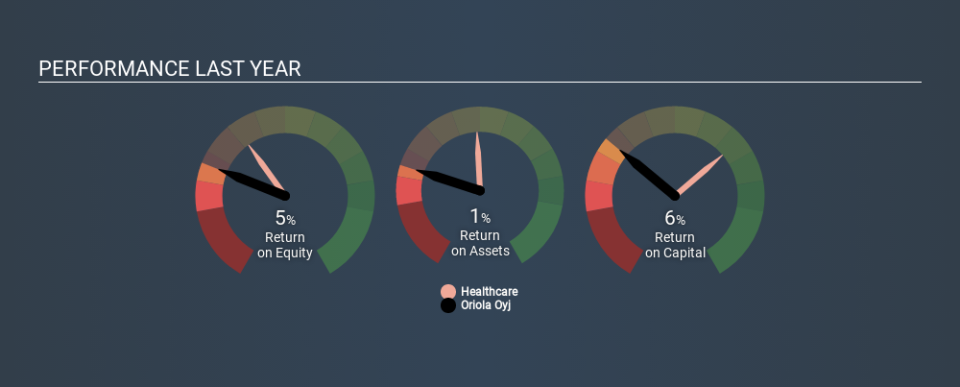
0.06 = €19m ÷ (€1.0b - €718m) (Based on the trailing twelve months to December 2019.)
So, Oriola Oyj has an ROCE of 6.0%.
View our latest analysis for Oriola Oyj
Is Oriola Oyj's ROCE Good?
ROCE is commonly used for comparing the performance of similar businesses. Using our data, Oriola Oyj's ROCE appears to be significantly below the 8.0% average in the Healthcare industry. This could be seen as a negative, as it suggests some competitors may be employing their capital more efficiently. Setting aside the industry comparison for now, Oriola Oyj's ROCE is mediocre in absolute terms, considering the risk of investing in stocks versus the safety of a bank account. Readers may find more attractive investment prospects elsewhere.
Oriola Oyj's current ROCE of 6.0% is lower than 3 years ago, when the company reported a 18% ROCE. So investors might consider if it has had issues recently. You can click on the image below to see (in greater detail) how Oriola Oyj's past growth compares to other companies.
When considering this metric, keep in mind that it is backwards looking, and not necessarily predictive. ROCE can be misleading for companies in cyclical industries, with returns looking impressive during the boom times, but very weak during the busts. ROCE is only a point-in-time measure. Future performance is what matters, and you can see analyst predictions in our free report on analyst forecasts for the company.
Oriola Oyj's Current Liabilities And Their Impact On Its ROCE
Short term (or current) liabilities, are things like supplier invoices, overdrafts, or tax bills that need to be paid within 12 months. The ROCE equation subtracts current liabilities from capital employed, so a company with a lot of current liabilities appears to have less capital employed, and a higher ROCE than otherwise. To counteract this, we check if a company has high current liabilities, relative to its total assets.
Oriola Oyj has total assets of €1.0b and current liabilities of €718m. As a result, its current liabilities are equal to approximately 70% of its total assets. Oriola Oyj has a fairly high level of current liabilities, meaningfully impacting its ROCE.
Our Take On Oriola Oyj's ROCE
Even so, the company reports a mediocre ROCE, and there may be better investments out there. Of course, you might find a fantastic investment by looking at a few good candidates. So take a peek at this free list of companies with modest (or no) debt, trading on a P/E below 20.
If you like to buy stocks alongside management, then you might just love this free list of companies. (Hint: insiders have been buying them).
If you spot an error that warrants correction, please contact the editor at editorial-team@simplywallst.com. This article by Simply Wall St is general in nature. It does not constitute a recommendation to buy or sell any stock, and does not take account of your objectives, or your financial situation. Simply Wall St has no position in the stocks mentioned.
We aim to bring you long-term focused research analysis driven by fundamental data. Note that our analysis may not factor in the latest price-sensitive company announcements or qualitative material. Thank you for reading.

