Why You Should Like Perseus SA’s (ATH:PERS) ROCE

Today we are going to look at Perseus SA (ATH:PERS) to see whether it might be an attractive investment prospect. To be precise, we'll consider its Return On Capital Employed (ROCE), as that will inform our view of the quality of the business.
First up, we'll look at what ROCE is and how we calculate it. Next, we'll compare it to others in its industry. And finally, we'll look at how its current liabilities are impacting its ROCE.
Return On Capital Employed (ROCE): What is it?
ROCE is a measure of a company's yearly pre-tax profit (its return), relative to the capital employed in the business. Generally speaking a higher ROCE is better. In brief, it is a useful tool, but it is not without drawbacks. Author Edwin Whiting says to be careful when comparing the ROCE of different businesses, since 'No two businesses are exactly alike.
How Do You Calculate Return On Capital Employed?
The formula for calculating the return on capital employed is:
Return on Capital Employed = Earnings Before Interest and Tax (EBIT) ÷ (Total Assets - Current Liabilities)
Or for Perseus:
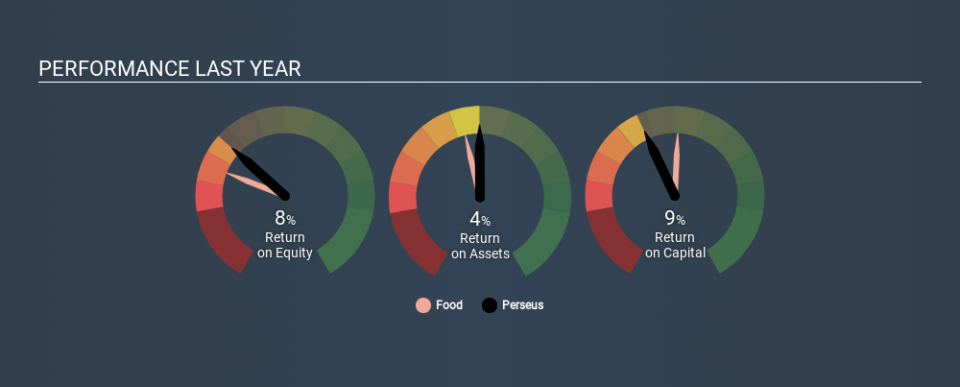
0.09 = €4.0m ÷ (€64m - €20m) (Based on the trailing twelve months to June 2019.)
Therefore, Perseus has an ROCE of 9.0%.
View our latest analysis for Perseus
Does Perseus Have A Good ROCE?
ROCE is commonly used for comparing the performance of similar businesses. In our analysis, Perseus's ROCE is meaningfully higher than the 6.0% average in the Food industry. We consider this a positive sign, because it suggests it uses capital more efficiently than similar companies. Separate from how Perseus stacks up against its industry, its ROCE in absolute terms is mediocre; relative to the returns on government bonds. Investors may wish to consider higher-performing investments.
Perseus's current ROCE of 9.0% is lower than its ROCE in the past, which was 12%, 3 years ago. This makes us wonder if the business is facing new challenges. You can click on the image below to see (in greater detail) how Perseus's past growth compares to other companies.
When considering this metric, keep in mind that it is backwards looking, and not necessarily predictive. ROCE can be deceptive for cyclical businesses, as returns can look incredible in boom times, and terribly low in downturns. ROCE is, after all, simply a snap shot of a single year. You can check if Perseus has cyclical profits by looking at this free graph of past earnings, revenue and cash flow.
How Perseus's Current Liabilities Impact Its ROCE
Short term (or current) liabilities, are things like supplier invoices, overdrafts, or tax bills that need to be paid within 12 months. Due to the way the ROCE equation works, having large bills due in the near term can make it look as though a company has less capital employed, and thus a higher ROCE than usual. To check the impact of this, we calculate if a company has high current liabilities relative to its total assets.
Perseus has total assets of €64m and current liabilities of €20m. Therefore its current liabilities are equivalent to approximately 31% of its total assets. Perseus has a medium level of current liabilities, which would boost its ROCE somewhat.
What We Can Learn From Perseus's ROCE
Despite this, its ROCE is still mediocre, and you may find more appealing investments elsewhere. But note: make sure you look for a great company, not just the first idea you come across. So take a peek at this free list of interesting companies with strong recent earnings growth (and a P/E ratio below 20).
I will like Perseus better if I see some big insider buys. While we wait, check out this free list of growing companies with considerable, recent, insider buying.
If you spot an error that warrants correction, please contact the editor at editorial-team@simplywallst.com. This article by Simply Wall St is general in nature. It does not constitute a recommendation to buy or sell any stock, and does not take account of your objectives, or your financial situation. Simply Wall St has no position in the stocks mentioned.
We aim to bring you long-term focused research analysis driven by fundamental data. Note that our analysis may not factor in the latest price-sensitive company announcements or qualitative material. Thank you for reading.

