Why PW Medtech Group Limited’s (HKG:1358) Use Of Investor Capital Doesn’t Look Great

Today we are going to look at PW Medtech Group Limited (HKG:1358) to see whether it might be an attractive investment prospect. In particular, we'll consider its Return On Capital Employed (ROCE), as that can give us insight into how profitably the company is able to employ capital in its business.
First of all, we'll work out how to calculate ROCE. Second, we'll look at its ROCE compared to similar companies. Last but not least, we'll look at what impact its current liabilities have on its ROCE.
What is Return On Capital Employed (ROCE)?
ROCE is a measure of a company's yearly pre-tax profit (its return), relative to the capital employed in the business. All else being equal, a better business will have a higher ROCE. In brief, it is a useful tool, but it is not without drawbacks. Author Edwin Whiting says to be careful when comparing the ROCE of different businesses, since 'No two businesses are exactly alike.'
How Do You Calculate Return On Capital Employed?
The formula for calculating the return on capital employed is:
Return on Capital Employed = Earnings Before Interest and Tax (EBIT) ÷ (Total Assets - Current Liabilities)
Or for PW Medtech Group:
0.014 = CN¥62m ÷ (CN¥5.2b - CN¥690m) (Based on the trailing twelve months to December 2018.)
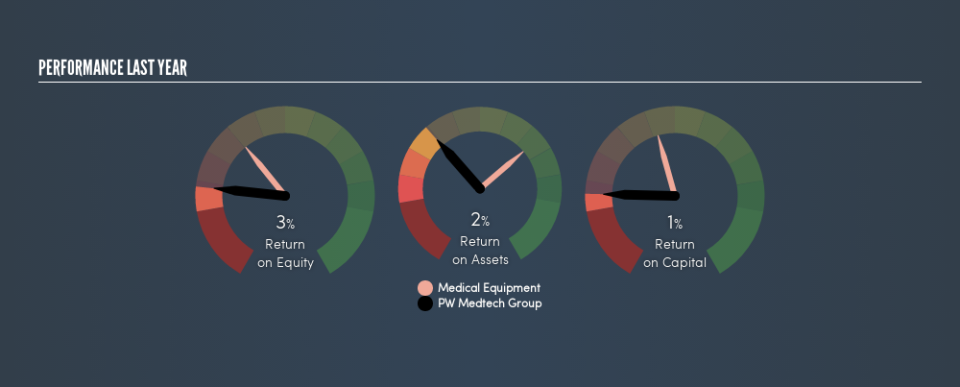
Therefore, PW Medtech Group has an ROCE of 1.4%.
See our latest analysis for PW Medtech Group
Does PW Medtech Group Have A Good ROCE?
ROCE is commonly used for comparing the performance of similar businesses. Using our data, PW Medtech Group's ROCE appears to be significantly below the 11% average in the Medical Equipment industry. This performance could be negative if sustained, as it suggests the business may underperform its industry. Putting aside PW Medtech Group's performance relative to its industry, its ROCE in absolute terms is poor - considering the risk of owning stocks compared to government bonds. Readers may wish to look for more rewarding investments.
PW Medtech Group's current ROCE of 1.4% is lower than 3 years ago, when the company reported a 10% ROCE. This makes us wonder if the business is facing new challenges. You can click on the image below to see (in greater detail) how PW Medtech Group's past growth compares to other companies.
Remember that this metric is backwards looking - it shows what has happened in the past, and does not accurately predict the future. ROCE can be misleading for companies in cyclical industries, with returns looking impressive during the boom times, but very weak during the busts. ROCE is, after all, simply a snap shot of a single year. What happens in the future is pretty important for investors, so we have prepared a free report on analyst forecasts for PW Medtech Group.
How PW Medtech Group's Current Liabilities Impact Its ROCE
Liabilities, such as supplier bills and bank overdrafts, are referred to as current liabilities if they need to be paid within 12 months. Due to the way ROCE is calculated, a high level of current liabilities makes a company look as though it has less capital employed, and thus can (sometimes unfairly) boost the ROCE. To counteract this, we check if a company has high current liabilities, relative to its total assets.
PW Medtech Group has total assets of CN¥5.2b and current liabilities of CN¥690m. Therefore its current liabilities are equivalent to approximately 13% of its total assets. With a very reasonable level of current liabilities, so the impact on ROCE is fairly minimal.
What We Can Learn From PW Medtech Group's ROCE
That's not a bad thing, however PW Medtech Group has a weak ROCE and may not be an attractive investment. You might be able to find a better investment than PW Medtech Group. If you want a selection of possible winners, check out this free list of interesting companies that trade on a P/E below 20 (but have proven they can grow earnings).
If you are like me, then you will not want to miss this free list of growing companies that insiders are buying.
We aim to bring you long-term focused research analysis driven by fundamental data. Note that our analysis may not factor in the latest price-sensitive company announcements or qualitative material.
If you spot an error that warrants correction, please contact the editor at editorial-team@simplywallst.com. This article by Simply Wall St is general in nature. It does not constitute a recommendation to buy or sell any stock, and does not take account of your objectives, or your financial situation. Simply Wall St has no position in the stocks mentioned. Thank you for reading.
