Why Refex Industries Limited’s (NSE:REFEX) Return On Capital Employed Is Impressive

Today we'll look at Refex Industries Limited (NSE:REFEX) and reflect on its potential as an investment. Specifically, we'll consider its Return On Capital Employed (ROCE), since that will give us an insight into how efficiently the business can generate profits from the capital it requires.
First of all, we'll work out how to calculate ROCE. Then we'll compare its ROCE to similar companies. Finally, we'll look at how its current liabilities affect its ROCE.
What is Return On Capital Employed (ROCE)?
ROCE measures the amount of pre-tax profits a company can generate from the capital employed in its business. All else being equal, a better business will have a higher ROCE. Overall, it is a valuable metric that has its flaws. Renowned investment researcher Michael Mauboussin has suggested that a high ROCE can indicate that 'one dollar invested in the company generates value of more than one dollar'.
So, How Do We Calculate ROCE?
The formula for calculating the return on capital employed is:
Return on Capital Employed = Earnings Before Interest and Tax (EBIT) ÷ (Total Assets - Current Liabilities)
Or for Refex Industries:
0.63 = ₹273m ÷ (₹1.6b - ₹1.2b) (Based on the trailing twelve months to March 2019.)
So, Refex Industries has an ROCE of 63%.
View our latest analysis for Refex Industries
Is Refex Industries's ROCE Good?
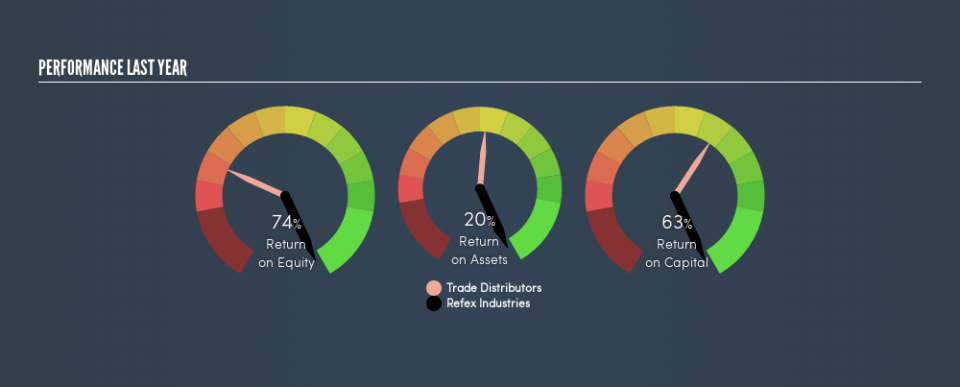
ROCE can be useful when making comparisons, such as between similar companies. Refex Industries's ROCE appears to be substantially greater than the 7.3% average in the Trade Distributors industry. We would consider this a positive, as it suggests it is using capital more effectively than other similar companies. Putting aside its position relative to its industry for now, in absolute terms, Refex Industries's ROCE is currently very good.
Our data shows that Refex Industries currently has an ROCE of 63%, compared to its ROCE of 16% 3 years ago. This makes us think about whether the company has been reinvesting shrewdly. You can see in the image below how Refex Industries's ROCE compares to its industry. Click to see more on past growth.
Remember that this metric is backwards looking - it shows what has happened in the past, and does not accurately predict the future. ROCE can be misleading for companies in cyclical industries, with returns looking impressive during the boom times, but very weak during the busts. ROCE is, after all, simply a snap shot of a single year. How cyclical is Refex Industries? You can see for yourself by looking at this free graph of past earnings, revenue and cash flow.
How Refex Industries's Current Liabilities Impact Its ROCE
Current liabilities include invoices, such as supplier payments, short-term debt, or a tax bill, that need to be paid within 12 months. Due to the way ROCE is calculated, a high level of current liabilities makes a company look as though it has less capital employed, and thus can (sometimes unfairly) boost the ROCE. To check the impact of this, we calculate if a company has high current liabilities relative to its total assets.
Refex Industries has total assets of ₹1.6b and current liabilities of ₹1.2b. As a result, its current liabilities are equal to approximately 73% of its total assets. While a high level of current liabilities boosts its ROCE, Refex Industries's returns are still very good.
The Bottom Line On Refex Industries's ROCE
So to us, the company is potentially worth investigating further. There might be better investments than Refex Industries out there, but you will have to work hard to find them . These promising businesses with rapidly growing earnings might be right up your alley.
If you like to buy stocks alongside management, then you might just love this free list of companies. (Hint: insiders have been buying them).
We aim to bring you long-term focused research analysis driven by fundamental data. Note that our analysis may not factor in the latest price-sensitive company announcements or qualitative material.
If you spot an error that warrants correction, please contact the editor at editorial-team@simplywallst.com. This article by Simply Wall St is general in nature. It does not constitute a recommendation to buy or sell any stock, and does not take account of your objectives, or your financial situation. Simply Wall St has no position in the stocks mentioned. Thank you for reading.

