Why We Like Royal Deluxe Holdings Limited’s (HKG:3789) 21% Return On Capital Employed

Today we are going to look at Royal Deluxe Holdings Limited (HKG:3789) to see whether it might be an attractive investment prospect. Specifically, we'll consider its Return On Capital Employed (ROCE), since that will give us an insight into how efficiently the business can generate profits from the capital it requires.
First of all, we'll work out how to calculate ROCE. Then we'll compare its ROCE to similar companies. Then we'll determine how its current liabilities are affecting its ROCE.
Return On Capital Employed (ROCE): What is it?
ROCE measures the 'return' (pre-tax profit) a company generates from capital employed in its business. Generally speaking a higher ROCE is better. Ultimately, it is a useful but imperfect metric. Renowned investment researcher Michael Mauboussin has suggested that a high ROCE can indicate that 'one dollar invested in the company generates value of more than one dollar'.
How Do You Calculate Return On Capital Employed?
Analysts use this formula to calculate return on capital employed:
Return on Capital Employed = Earnings Before Interest and Tax (EBIT) ÷ (Total Assets - Current Liabilities)
Or for Royal Deluxe Holdings:
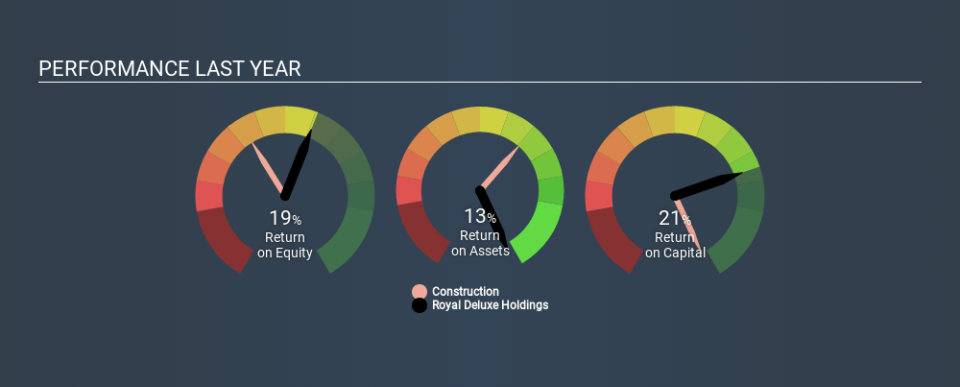
0.21 = HK$49m ÷ (HK$380m - HK$140m) (Based on the trailing twelve months to September 2019.)
Therefore, Royal Deluxe Holdings has an ROCE of 21%.
See our latest analysis for Royal Deluxe Holdings
Does Royal Deluxe Holdings Have A Good ROCE?
One way to assess ROCE is to compare similar companies. Using our data, we find that Royal Deluxe Holdings's ROCE is meaningfully better than the 12% average in the Construction industry. We would consider this a positive, as it suggests it is using capital more effectively than other similar companies. Putting aside its position relative to its industry for now, in absolute terms, Royal Deluxe Holdings's ROCE is currently very good.
We can see that, Royal Deluxe Holdings currently has an ROCE of 21%, less than the 51% it reported 3 years ago. Therefore we wonder if the company is facing new headwinds. The image below shows how Royal Deluxe Holdings's ROCE compares to its industry, and you can click it to see more detail on its past growth.
It is important to remember that ROCE shows past performance, and is not necessarily predictive. ROCE can be misleading for companies in cyclical industries, with returns looking impressive during the boom times, but very weak during the busts. ROCE is, after all, simply a snap shot of a single year. You can check if Royal Deluxe Holdings has cyclical profits by looking at this free graph of past earnings, revenue and cash flow.
How Royal Deluxe Holdings's Current Liabilities Impact Its ROCE
Current liabilities are short term bills and invoices that need to be paid in 12 months or less. Due to the way the ROCE equation works, having large bills due in the near term can make it look as though a company has less capital employed, and thus a higher ROCE than usual. To counteract this, we check if a company has high current liabilities, relative to its total assets.
Royal Deluxe Holdings has current liabilities of HK$140m and total assets of HK$380m. As a result, its current liabilities are equal to approximately 37% of its total assets. Royal Deluxe Holdings has a medium level of current liabilities, boosting its ROCE somewhat.
Our Take On Royal Deluxe Holdings's ROCE
Even so, it has a great ROCE, and could be an attractive prospect for further research. Royal Deluxe Holdings looks strong on this analysis, but there are plenty of other companies that could be a good opportunity . Here is a free list of companies growing earnings rapidly.
For those who like to find winning investments this free list of growing companies with recent insider purchasing, could be just the ticket.
If you spot an error that warrants correction, please contact the editor at editorial-team@simplywallst.com. This article by Simply Wall St is general in nature. It does not constitute a recommendation to buy or sell any stock, and does not take account of your objectives, or your financial situation. Simply Wall St has no position in the stocks mentioned.
We aim to bring you long-term focused research analysis driven by fundamental data. Note that our analysis may not factor in the latest price-sensitive company announcements or qualitative material. Thank you for reading.
