Why Sanco Industries Limited’s (NSE:SANCO) Return On Capital Employed Is Impressive

Want to participate in a short research study? Help shape the future of investing tools and receive a $20 prize!
Today we’ll look at Sanco Industries Limited (NSE:SANCO) and reflect on its potential as an investment. To be precise, we’ll consider its Return On Capital Employed (ROCE), as that will inform our view of the quality of the business.
First of all, we’ll work out how to calculate ROCE. Then we’ll compare its ROCE to similar companies. Then we’ll determine how its current liabilities are affecting its ROCE.
What is Return On Capital Employed (ROCE)?
ROCE is a metric for evaluating how much pre-tax income (in percentage terms) a company earns on the capital invested in its business. In general, businesses with a higher ROCE are usually better quality. Overall, it is a valuable metric that has its flaws. Renowned investment researcher Michael Mauboussin has suggested that a high ROCE can indicate that ‘one dollar invested in the company generates value of more than one dollar’.
So, How Do We Calculate ROCE?
The formula for calculating the return on capital employed is:
Return on Capital Employed = Earnings Before Interest and Tax (EBIT) ÷ (Total Assets – Current Liabilities)
Or for Sanco Industries:
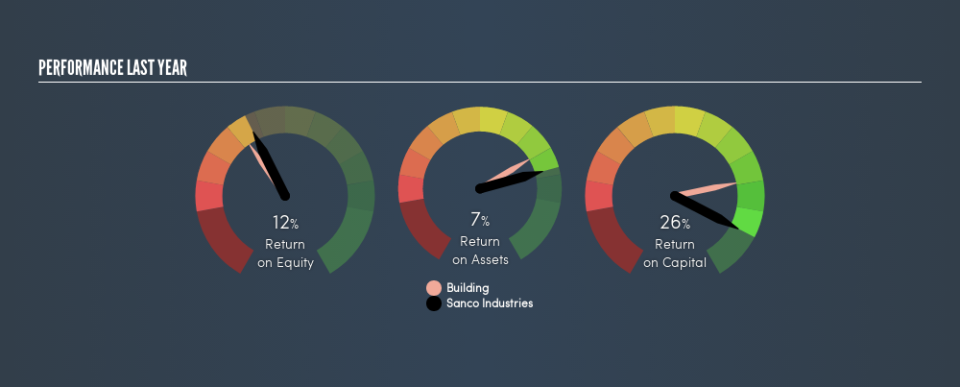
0.26 = ₹123m ÷ (₹1.4b – ₹967m) (Based on the trailing twelve months to March 2018.)
So, Sanco Industries has an ROCE of 26%.
Check out our latest analysis for Sanco Industries
Is Sanco Industries’s ROCE Good?
When making comparisons between similar businesses, investors may find ROCE useful. Sanco Industries’s ROCE appears to be substantially greater than the 12% average in the Building industry. I think that’s good to see, since it implies the company is better than other companies at making the most of its capital. Regardless of the industry comparison, in absolute terms, Sanco Industries’s ROCE currently appears to be excellent.
Remember that this metric is backwards looking – it shows what has happened in the past, and does not accurately predict the future. ROCE can be misleading for companies in cyclical industries, with returns looking impressive during the boom times, but very weak during the busts. ROCE is only a point-in-time measure. If Sanco Industries is cyclical, it could make sense to check out this free graph of past earnings, revenue and cash flow.
Sanco Industries’s Current Liabilities And Their Impact On Its ROCE
Liabilities, such as supplier bills and bank overdrafts, are referred to as current liabilities if they need to be paid within 12 months. Due to the way ROCE is calculated, a high level of current liabilities makes a company look as though it has less capital employed, and thus can (sometimes unfairly) boost the ROCE. To counter this, investors can check if a company has high current liabilities relative to total assets.
Sanco Industries has total assets of ₹1.4b and current liabilities of ₹967m. As a result, its current liabilities are equal to approximately 67% of its total assets. While a high level of current liabilities boosts its ROCE, Sanco Industries’s returns are still very good.
What We Can Learn From Sanco Industries’s ROCE
So to us, the company is potentially worth investigating further. You might be able to find a better buy than Sanco Industries. If you want a selection of possible winners, check out this free list of interesting companies that trade on a P/E below 20 (but have proven they can grow earnings).
If you are like me, then you will not want to miss this free list of growing companies that insiders are buying.
We aim to bring you long-term focused research analysis driven by fundamental data. Note that our analysis may not factor in the latest price-sensitive company announcements or qualitative material.
If you spot an error that warrants correction, please contact the editor at editorial-team@simplywallst.com. This article by Simply Wall St is general in nature. It does not constitute a recommendation to buy or sell any stock, and does not take account of your objectives, or your financial situation. Simply Wall St has no position in the stocks mentioned. On rare occasion, data errors may occur. Thank you for reading.
