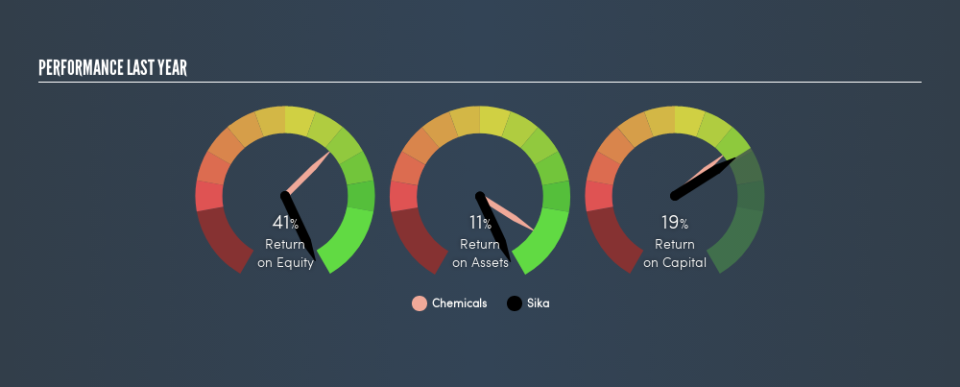
Why We Like Sika AG’s (VTX:SIKA) 19% Return On Capital Employed

Today we’ll evaluate Sika AG (VTX:SIKA) to determine whether it could have potential as an investment idea. In particular, we’ll consider its Return On Capital Employed (ROCE), as that can give us insight into how profitably the company is able to employ capital in its business.
First of all, we’ll work out how to calculate ROCE. Then we’ll compare its ROCE to similar companies. Last but not least, we’ll look at what impact its current liabilities have on its ROCE.
What is Return On Capital Employed (ROCE)?
ROCE is a measure of a company’s yearly pre-tax profit (its return), relative to the capital employed in the business. All else being equal, a better business will have a higher ROCE. Ultimately, it is a useful but imperfect metric. Author Edwin Whiting says to be careful when comparing the ROCE of different businesses, since ‘No two businesses are exactly alike.’
So, How Do We Calculate ROCE?
Analysts use this formula to calculate return on capital employed:
Return on Capital Employed = Earnings Before Interest and Tax (EBIT) ÷ (Total Assets – Current Liabilities)
Or for Sika:
0.19 = CHF942m ÷ (CHF6.4b – CHF1.4b) (Based on the trailing twelve months to December 2018.)
Therefore, Sika has an ROCE of 19%.
Check out our latest analysis for Sika
Does Sika Have A Good ROCE?
When making comparisons between similar businesses, investors may find ROCE useful. Sika’s ROCE appears to be substantially greater than the 15% average in the Chemicals industry. We consider this a positive sign, because it suggests it uses capital more efficiently than similar companies. Separate from Sika’s performance relative to its industry, its ROCE in absolute terms looks satisfactory, and it may be worth researching in more depth.
When considering ROCE, bear in mind that it reflects the past and does not necessarily predict the future. Companies in cyclical industries can be difficult to understand using ROCE, as returns typically look high during boom times, and low during busts. ROCE is only a point-in-time measure. Future performance is what matters, and you can see analyst predictions in our free report on analyst forecasts for the company.
What Are Current Liabilities, And How Do They Affect Sika’s ROCE?
Liabilities, such as supplier bills and bank overdrafts, are referred to as current liabilities if they need to be paid within 12 months. Due to the way the ROCE equation works, having large bills due in the near term can make it look as though a company has less capital employed, and thus a higher ROCE than usual. To counteract this, we check if a company has high current liabilities, relative to its total assets.
Sika has total assets of CHF6.4b and current liabilities of CHF1.4b. Therefore its current liabilities are equivalent to approximately 22% of its total assets. A fairly low level of current liabilities is not influencing the ROCE too much.
What We Can Learn From Sika’s ROCE
With that in mind, Sika’s ROCE appears pretty good. Of course, you might find a fantastic investment by looking at a few good candidates. So take a peek at this free list of companies with modest (or no) debt, trading on a P/E below 20.
If you are like me, then you will not want to miss this free list of growing companies that insiders are buying.
We aim to bring you long-term focused research analysis driven by fundamental data. Note that our analysis may not factor in the latest price-sensitive company announcements or qualitative material.
If you spot an error that warrants correction, please contact the editor at editorial-team@simplywallst.com. This article by Simply Wall St is general in nature. It does not constitute a recommendation to buy or sell any stock, and does not take account of your objectives, or your financial situation. Simply Wall St has no position in the stocks mentioned. Thank you for reading.

